- Seite 1 und 2:
Zweijahresbericht GeoForschungsZent
- Seite 3 und 4:
Inhaltsverzeichnis Vorwort III Einl
- Seite 5 und 6:
Vorwort Der vorliegende Zweijahresb
- Seite 7 und 8:
Das System Erde - Forschungsgegenst
- Seite 9 und 10:
Geodynamische Prozesse sind als rä
- Seite 11 und 12:
Abb. 4: Geophysikalisches Observato
- Seite 13 und 14:
GFZ beteiligt sich maßgeblich im F
- Seite 15 und 16:
GITEWS - German-Indonesian Tsunami
- Seite 17 und 18:
die Simulationen auf eine gesichert
- Seite 19 und 20:
Abb. 8: Verteilung der Tsunami Boje
- Seite 21 und 22:
Abb. 10: Schematischer Aufbau des G
- Seite 23 und 24:
ten sind in thematischen Gruppen or
- Seite 25 und 26:
Das Bam-Erdbeben 2003: Präzise Her
- Seite 27 und 28:
so dass man hier ein komplexeres St
- Seite 29 und 30:
Abb. 4: Berechnete Bodenverformunge
- Seite 31 und 32:
Diskussion und Schlußfolgerungen D
- Seite 33 und 34:
Wang, R., Xia, Y., Grosser, H., Wet
- Seite 35 und 36:
D-INSAR-Forschung in China: Monitor
- Seite 37 und 38: Abb. 3: Auswirkung von Absenkungen:
- Seite 39 und 40: Abb. 6: Mit Nivellement gemessene A
- Seite 41 und 42: Abb. 10a bis c: Durchschnittliche B
- Seite 43 und 44: Prozesse, die die Anden formten - 1
- Seite 45 und 46: 80 Dissertationsprojekten über 15
- Seite 47 und 48: wurde mit den gleichen Apparaturen,
- Seite 49 und 50: dung, die sich von der seismisch be
- Seite 51 und 52: Abb. 9: Die linke Abbildung zeigt d
- Seite 53 und 54: Abb. 11: Korrelation verschiedener
- Seite 55 und 56: (vgl. Abb. 13). Die Zentralen Anden
- Seite 57 und 58: 6 Mill. Jahren gesteuert worden. Zu
- Seite 59 und 60: Schurr, B., A. Rietbrock, G. Asch,
- Seite 61 und 62: „Inkaba ye Africa“ - dem dynami
- Seite 63 und 64: von Meeresströmungen, die klimatis
- Seite 65 und 66: Entwicklung der Kontinentalränder
- Seite 67 und 68: CHAMP und GRACE - erfolgreiche Schw
- Seite 69 und 70: sie bereits mehr als 21000-mal die
- Seite 71 und 72: Abb. 6: C 20-Variation abgeleitet a
- Seite 73 und 74: Abb. 10a, b: Zeitserie der Beckenmi
- Seite 75 und 76: Abb. 14: Zwei Ausschnitte aus der K
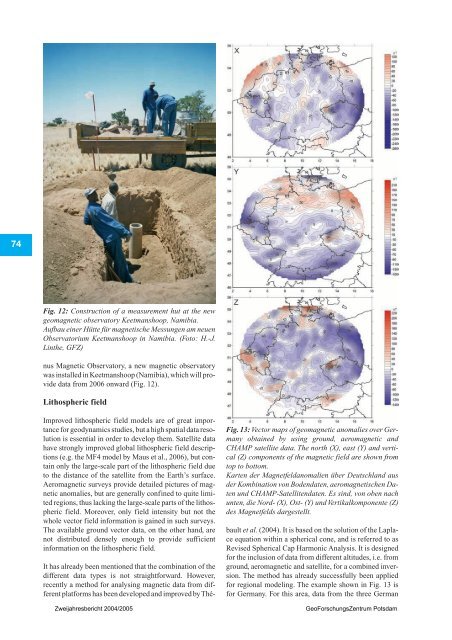
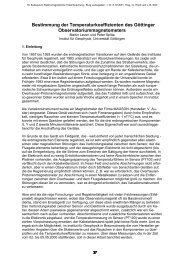
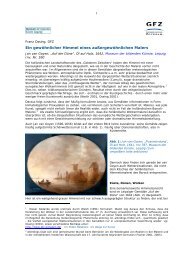
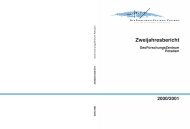
- Seite 77 und 78: A comprehensive view of the Earth
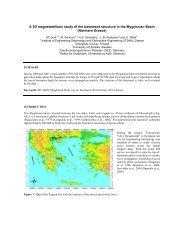
- Seite 79 und 80: Fig. 2: Participants of the interna
- Seite 81 und 82: Fig. 4: Orienting a first prototype
- Seite 83 und 84: Fig. 6: Coverage of the Earth with
- Seite 85 und 86: Fig. 7: Percentage change of the ge
- Seite 87: Fig. 10: Two teams from GFZ Potsdam
- Seite 91 und 92: CONTINENT - Der Baikalsee: ein auß
- Seite 93 und 94: wird das südliche Einzugsgebiet de
- Seite 95 und 96: masignale im Sediment ab. Der Baika
- Seite 97 und 98: Abb. 6: Ausstattung der Sedimentfal
- Seite 99 und 100: Abb. 8: Chlorophyll-a-Konzentration
- Seite 101 und 102: optischen Rahmenbedingungen, die du
- Seite 103 und 104: Abb. 13: Häufigkeit des Chl-a, sow
- Seite 105 und 106: Am GFZ Potsdam wurden die Kerne gem
- Seite 107 und 108: (Biome) evaluiert (Prentice et al.,
- Seite 109 und 110: Maerki, M., Müller, B., Wehrli, B.
- Seite 111 und 112: Seismische Vorauserkundung im Tunne
- Seite 113 und 114: Abb. 2: Seismogramme der numerische
- Seite 115 und 116: Abb. 5: Daten nach Bearbeitung (Emp
- Seite 117 und 118: Technologieentwicklung im In-Situ-
- Seite 119 und 120: Abb. 2: Geologisches Blockbild der
- Seite 121 und 122: Abb. 4: Das Abbild der elektrischen
- Seite 123 und 124: Rissleitfähigkeit von 1 Dm hin. Di
- Seite 125 und 126: ge Nutzung eines Heißwasserreservo
- Seite 127 und 128: Hochdruck-Mineralphysik mit Synchro
- Seite 129 und 130: innerhalb von Druckkammern mit hohe
- Seite 131 und 132: zur Probe durch intransparente Stem
- Seite 133 und 134: Druckmessung Mineralphysikalische H
- Seite 135 und 136: am Probenende sollte die Energie m
- Seite 137 und 138: Abb. 14: Ultraschall-Daten-Transfer
- Seite 139 und 140:
Abb. 18: Elastische Wellengeschwind
- Seite 141 und 142:
Abb. 22: Transiente Messungen am Qu
- Seite 143 und 144:
gramm MgSiO 3 (Angel & Hugh-Jones,
- Seite 145 und 146:
Abb. 30: Weltweite Entwicklung der
- Seite 147 und 148:
Woodland, A.B., Angel, R.J. (1997).
- Seite 149 und 150:
Neue experimentelle Entwicklungen a
- Seite 151 und 152:
Abb. 3: Tiefenprofil einer Referenz
- Seite 153 und 154:
A B Abb.5:SIMS-Kalibrierungskurven
- Seite 155 und 156:
Risikokarten für Deutschland: erst
- Seite 157 und 158:
Da die Auswirkungen der meisten Nat
- Seite 159 und 160:
Abb. 4:A: Choroplethenkarte des auf
- Seite 161 und 162:
ERA-40 Daten des ECMWF gewonnen. Mi
- Seite 163 und 164:
Abb. 9: Mittlere Wohngebäudezusamm
- Seite 165 und 166:
Kaplan, S., Garrick, B. J.: On the
- Seite 167 und 168:
Das Industrie-Partnerschaftprogramm
- Seite 169 und 170:
Abb. 2: Vier grundlegende Elemente
- Seite 171 und 172:
Abb. 5: Die Analyse von Muttergeste
- Seite 173 und 174:
den als Untersuchungsgebiet ausgew
- Seite 175 und 176:
tionskinetischen Modellen, welche e
- Seite 177 und 178:
Zweijahresbericht 2004/2005 GeoFors
- Seite 179 und 180:
Department 1 Geodäsie und Fernerku
- Seite 181 und 182:
Die am GFZ-Analysezentrum erzeugten
- Seite 183 und 184:
Abb. 1.6: Mittelwerte der von GFZ u
- Seite 185 und 186:
Tabelle 1.1:Residuen zur kombiniert
- Seite 187 und 188:
gression der Vergletscherung in die
- Seite 189 und 190:
Abb 1.17: Aus den am 30.07. (oben)
- Seite 191 und 192:
Validierung der mittels GPS vermess
- Seite 193 und 194:
Abb. 1.24: Die geografische Verteil
- Seite 195 und 196:
Vergleich der zeitlichen Variatione
- Seite 197 und 198:
Abb. 1.33: Globale und regional ver
- Seite 199 und 200:
Abb. 1.35: Vergleich von GPS-Okkult
- Seite 201 und 202:
weltweit verteilten Stationen werde
- Seite 203 und 204:
wicklung divergieren die Abschätzu
- Seite 205 und 206:
im Wärmehaushalt zurückgeführt w
- Seite 207 und 208:
zungsmethode und dem Grad der Kugel
- Seite 209 und 210:
a) b) Die Zone der niedrigen Dichte
- Seite 211 und 212:
a) b) Abb. 1.54: (A) Ein erstes Dic
- Seite 213 und 214:
Abb. 1.58: Alternative geodynamisch
- Seite 215 und 216:
kungen und hydrologischen Effekten
- Seite 217 und 218:
strömen mit dem Abfluss in die Amu
- Seite 219 und 220:
Fernerkundung Die Fernerkundung ste
- Seite 221 und 222:
schen Arten deutlich im Sichtbaren
- Seite 223 und 224:
Abb. 1.75: Skalierungsexperiment: a
- Seite 225 und 226:
Abb. 1.78: Spektrale Varianten von
- Seite 227 und 228:
endgültigen Simulationsspektren er
- Seite 229 und 230:
Department 2 Physik der Erde Die Br
- Seite 231 und 232:
Abb. 2.2: Temporäre Station Dissel
- Seite 233 und 234:
strukturen im direkten Umfeld des G
- Seite 235 und 236:
Abb. 2.8: Microarray-Messungen in I
- Seite 237 und 238:
Vulkanismus und Erdbeben Einer mitt
- Seite 239 und 240:
und Gefährdungspotenzial der Erde
- Seite 241 und 242:
Abb. 2.19: Modell des Aufstiegs von
- Seite 243 und 244:
Abb. 2.22: Das Seismometer der Stat
- Seite 245 und 246:
Abb. 2.26: Im Berichtszeitraum fand
- Seite 247 und 248:
Abb. 2.29: Verteilung des elektrisc
- Seite 249 und 250:
Abb. 2.31: Beispiel eines tomograph
- Seite 251 und 252:
Abb. 2.33: (a) bis (c) Wachsendes P
- Seite 253 und 254:
Abb. 2.35: Illustration des neuen M
- Seite 255 und 256:
Methode der Receiver Funktionen ist
- Seite 257 und 258:
Abb. 2.42: Untergrenze der afrikani
- Seite 259 und 260:
überwiegend in Europa und dem Mitt
- Seite 261 und 262:
für alle geologischen Erscheinungs
- Seite 263 und 264:
Abb. 2.51b: Sicher ist sicher! Vors
- Seite 265 und 266:
Vor der wissenschaftlichen Modellie
- Seite 267 und 268:
Abb. 2.57: Teilnehmer des Festkollo
- Seite 269 und 270:
y eine Messkampagne an 40 Säkularp
- Seite 271 und 272:
nen aus Modellrechnungen, mit welch
- Seite 273 und 274:
kurz bevor geomagnetische Jerks beo
- Seite 275 und 276:
Anhand von Archiven kosmogener Nukl
- Seite 277 und 278:
Abb. 2.68: Globale Verteilung der i
- Seite 279 und 280:
der linken Seite der Abb. 2.70 entn
- Seite 281 und 282:
Kind, R., X. Yuan, J. Saul, D. Nels
- Seite 283 und 284:
Zweijahresbericht 2004/2005 GeoFors
- Seite 285 und 286:
Department 3 Geodynamik Tektonische
- Seite 287 und 288:
Abb. 3.3: Datierung der Spät-Pleis
- Seite 289 und 290:
geführt. Ausgehend von ‚state of
- Seite 291 und 292:
zu setzen und Vorhersagestrategien
- Seite 293 und 294:
Bruchentstehung und Bruchausbreitun
- Seite 295 und 296:
Abb. 3.10: Oben Mitte: Ummantelte G
- Seite 297 und 298:
Abb. 3.15: Oben: Topographische Kar
- Seite 299 und 300:
Abb. 3.17: (a) Modellaufbau des num
- Seite 301 und 302:
Abb. 3.20 zeigt die Permeabilität
- Seite 303 und 304:
auch in allen diesen Fällen noch a
- Seite 305 und 306:
Abb. 3.26: Dokumentation eines Dür
- Seite 307 und 308:
Abb. 3.29: Lage des El’gygytgyn I
- Seite 309 und 310:
weniger (Kaltzeiten) verdünnt. Da
- Seite 311 und 312:
Zweijahresbericht 2004/2005 GeoFors
- Seite 313 und 314:
Department 4 Chemie der Erde Geodyn
- Seite 315 und 316:
Abb.4.3:Experimentell bestimmte B-I
- Seite 317 und 318:
System H2O-NaCl-B 2O 3 bei 400 °C/
- Seite 319 und 320:
Abb. 4.9: (a) Brom-Konzentrationen
- Seite 321 und 322:
Abb. 4.13: Zr-, U- und Pb-Molalitä
- Seite 323 und 324:
Abb. 4.16: Spurenelementverteilungs
- Seite 325 und 326:
durch Fluide produzierten Mikrophas
- Seite 327 und 328:
Abb. 4.21: (a) HRTEM-Aufnahme einer
- Seite 329 und 330:
stark richtungsabhängig ist. Unser
- Seite 331 und 332:
Abb. 4.28: KTB-Lokation von einem L
- Seite 333 und 334:
Abb. 4.30: Horizontaler Schnitt ein
- Seite 335 und 336:
analysiert. Um das Verhalten der Sp
- Seite 337 und 338:
sehr weiten Bereich des Erdmantels
- Seite 339 und 340:
Abb. 4.37: Das lichtoptische Bild z
- Seite 341 und 342:
Abb. 4.40: (a) Zylindrische Probe e
- Seite 343 und 344:
Abb. 4.43: Rückgestreute Elektrone
- Seite 345 und 346:
Abb.4.46:Mit zunehmender Probenlän
- Seite 347 und 348:
nen Richtungen bestimmt. In Abb. 4.
- Seite 349 und 350:
Abb.4.53:Scher- und adiabatisches K
- Seite 351 und 352:
Abb. 4.56: Aufbau des Experiments z
- Seite 353 und 354:
Signaturen radiogener Isotope, v. a
- Seite 355 und 356:
Abb. 4.60: Nd (epsilon Nd)- und Sr-
- Seite 357 und 358:
Das Zentraleuropäische Beckensyste
- Seite 359 und 360:
chergesteine der Skagerrak-Formatio
- Seite 361 und 362:
Abb. 4.71: Verteilung des Salzgehal
- Seite 363 und 364:
Abb. 4.74: Teufenplots ausgewählte
- Seite 365 und 366:
neuester Beckenmodellierungssoftwar
- Seite 367 und 368:
sowie die Modellierung des davon ab
- Seite 369 und 370:
ses Modell hat jahrzehntelang Anwen
- Seite 371 und 372:
Abb. 4.81: Lage des Untersuchungsge
- Seite 373 und 374:
Abb. 4.84: a) 3D Modell des Norwegi
- Seite 375 und 376:
Abb.4.86:Modellierte Druck- und Tem
- Seite 377 und 378:
Abb. 4.88: Foto der DEBITS Bohrloka
- Seite 379 und 380:
Abb. 4.90: Abhängigkeit der relati
- Seite 381 und 382:
Abb. 4.94: Lage der Bohrungen im Gu
- Seite 383 und 384:
führt. Neben dem GFZ Potsdam, Sekt
- Seite 385 und 386:
of highly evolved tin-granite magma
- Seite 387 und 388:
Department 5 Geoengineering Die Arb
- Seite 389 und 390:
Abb. 5.4: Anregung seismischer Impu
- Seite 391 und 392:
davor liegt die sog. Piora-Mulde, d
- Seite 393 und 394:
Abb. 5.12: Versuchsdeich mit seismi
- Seite 395 und 396:
Abb. 5.17: Verteilung von Salzstruk
- Seite 397 und 398:
Abb. 5.20: Geologischer Schnitt dur
- Seite 399 und 400:
Abb. 5.23: Bohrkerne aus der Weser-
- Seite 401 und 402:
Abb. 5.27: Schema einer „Fracture
- Seite 403 und 404:
Abb. 5.32: Epizentren katalogisiert
- Seite 405 und 406:
Abb. 5.35: Vulnerabilitäts-(Schade
- Seite 407 und 408:
isiko und wesentliche Teile zum Wer
- Seite 409 und 410:
ares Verhalten in Übereinstimmung
- Seite 411 und 412:
kreisregelung um Kegelachsen im Win
- Seite 413 und 414:
Abb. 5.45: Beispiele für die zeitl
- Seite 415 und 416:
Abb.5.50:Hochwasserwahrscheinlichke
- Seite 417 und 418:
Abb. 5.53: Jährlichkeiten der Rhei
- Seite 419 und 420:
schungsnetz Naturkatastrophen (DFNK
- Seite 421 und 422:
Das GFZ Potsdam auf einen Blick Nam
- Seite 423 und 424:
Gremien des GeoForschungsZentrums P
- Seite 425 und 426:
Abb. 3: Entwicklung der Ausbildungs
- Seite 427 und 428:
oberfläche, in den Meeren und in d
- Seite 429 und 430:
6. Modellierung: Die Modellierung k
- Seite 431 und 432:
• Einrichtung eines ICSU-Weltdate
- Seite 433 und 434:
Abb. 12: Entwicklung des Massendate
- Seite 435 und 436:
zone untersucht werden. Im Jahr 200
- Seite 437 und 438:
zu Impaktgläsern im Bohrlochtiefst
- Seite 439 und 440:
gen. Die OSG verwendete hierzu sowo
- Seite 441 und 442:
sich dabei in sehr ähnlichem Umfel
- Seite 443 und 444:
Abb. 30: Schematische Ansicht des I
- Seite 445 und 446:
jekten und tiefen Erdbebenbeobachtu
- Seite 447 und 448:
Prof. Dr. Günter Borm, Direktor de
- Seite 449 und 450:
Dipl.-Min. Marcus Wigand, „Geoche
- Seite 451 und 452:
Rayleigh wave tomography. Geophys.
- Seite 453 und 454:
zie Delta, Northwest Territories, C
- Seite 455 und 456:
Larter, S.R., di Primio, R. (2005):
- Seite 457 und 458:
Müller, H.-J., Schilling, F.R., La
- Seite 459 und 460:
Rybacki, E.; Dresen, G. (2004): Def
- Seite 461 und 462:
Bouguer gravity anomaly. Geophys. J
- Seite 463 und 464:
Glossar AAM Atmospheric Angular Mom