- Page 1 and 2:
This prospectus constitutes a base
- Page 3 and 4:
Summary The following constitutes a
- Page 5 and 6:
Therefore, if a Credit Linkage Even
- Page 7 and 8:
Additional Risks with respect to No
- Page 9 and 10:
General Description of the Programm
- Page 11 and 12:
Credit-Linkage of Principal Payment
- Page 13 and 14:
Physical Settlement Amount Redempti
- Page 15 and 16:
Summary relating to Commerzbank Akt
- Page 17 and 18:
Sollten sich ein oder mehrere der f
- Page 19 and 20:
Anleihegläubiger haben im Verlustf
- Page 21 and 22:
kumulatives oder gar exponentiell h
- Page 23 and 24:
Zusammenfassung der Programm-Anleih
- Page 25 and 26:
Sonstige Bestimmungen hinsichtlich
- Page 27 and 28:
Rückzahlung bei Endfälligkeit und
- Page 29 and 30:
Zusammenfassung hinsichtlich der Co
- Page 31 and 32:
In addition, the Final Terms may pr
- Page 33 and 34:
Further, Credit Linkage Events may
- Page 35 and 36:
(including hedging transactions) wi
- Page 37 and 38:
Transaction Costs When Notes are pu
- Page 39 and 40:
Notes correspondingly rises, the pr
- Page 41 and 42:
may have to obtain liquidity from t
- Page 43 and 44:
Group over the long term. In partic
- Page 45 and 46:
the Mittelstandsbank, Central and E
- Page 47 and 48:
further decline in market values an
- Page 49 and 50:
compliance with the Basel II requir
- Page 51 and 52:
Important Notice about this Prospec
- Page 53 and 54:
General Information Commerzbank Akt
- Page 55 and 56:
Credit Linkage of Capital (Derivati
- Page 57 and 58:
edeem the Notes early upon the occu
- Page 59 and 60:
Moody's S&P Fitch Rating Symbol (Lo
- Page 61 and 62:
Wenn Ergänzte Anleihebedingungen (
- Page 63 and 64:
Programme Terms and Conditions of t
- Page 65 and 66:
Der folgende Absatz (2) ist nur auf
- Page 67 and 68:
Der folgende Absatz ist bei Doppelw
- Page 69 and 70:
Der folgende Absatz (2) ist auf all
- Page 71 and 72:
kein Zinszahlungstag vergangen ist,
- Page 73 and 74:
Tag vorangeht, an dem sie zur Rück
- Page 75 and 76:
jeweiligen Zinsfestsetzungstag von
- Page 77 and 78:
werden)/(sofern erforderlich auf da
- Page 79 and 80:
etreffende Zinsperiode nach ihrem b
- Page 81 and 82:
anderen Beobachtungszeitraum/andere
- Page 83 and 84:
Zinsberechnungszeitr aum, in dem de
- Page 85 and 86:
§ 4 (RÜCKZAHLUNG) [(1)] [Vorbehal
- Page 87 and 88:
vorstehendem Absatz (a) ermittelte
- Page 89 and 90:
Im Fall von Teilschuldverschreibung
- Page 91 and 92:
Bezugsbetrag des Hypothetischen Cre
- Page 93 and 94:
§ 5 (VORZEITIGE RÜCKZAHLUNG, RÜC
- Page 95 and 96:
Der folgende Absatz (3) ist auf all
- Page 97 and 98:
unverzüglich der Emittentin, den Z
- Page 99 and 100:
Der folgende Absatz (1) ist im Fall
- Page 101 and 102:
Rückzahlungsbetrages um den Absich
- Page 103 and 104:
nachfolgend aufgeführten Spreads e
- Page 105 and 106:
mit einer anderen Rechtsperson, sei
- Page 107 and 108:
Kreditereignisses [und Auslösenden
- Page 109 and 110:
unterlässt, Zahlungen, deren Gesam
- Page 111 and 112:
Der folgende Absatz ist im Falle vo
- Page 113 and 114:
"Nichtanerkennung/Moratorium" besch
- Page 115 and 116:
Der folgende Absatz ist im Falle vo
- Page 117 and 118:
Die Emittentin [macht/kann] ein Kre
- Page 119 and 120:
Die folgende Definition ist, hier e
- Page 121 and 122:
"GewichtungsbetragRS" ist [0,008/[a
- Page 123 and 124:
(2) Der "Spread-Barausgleichsbetrag
- Page 125 and 126:
den dort aufgeführten Referenzschu
- Page 127 and 128:
Endkurs-Banken eine Endkurs-Quotier
- Page 129 and 130:
Der folgende Unterabsatz ist im Fal
- Page 131 and 132:
Übertragungstag wird ausschließli
- Page 133 and 134:
werden kann, ohne dass es der Anzei
- Page 135 and 136:
Zustimmungspflichtiges Darlehen/nic
- Page 137 and 138:
entweder (1) der Emittentin (soweit
- Page 139 and 140:
Referenzschuldner kein Hoheitlicher
- Page 141 and 142:
Wandelbaren Verbindlichkeit oder ei
- Page 143 and 144:
entsprechenden Schuldners, falls de
- Page 145 and 146:
Auflaufende Verbindlichkeit ist, bl
- Page 147 and 148:
Der folgende Absatz gilt nur bei ei
- Page 149 and 150:
Primärschuldner gelten). Die folge
- Page 151 and 152:
Garantie), abtreten oder verkaufen,
- Page 153 and 154:
Verbindlichkeitsmerkmal nur in Bezu
- Page 155 and 156:
(d) Für die Zwecke der Anwendung d
- Page 157 and 158:
(2) Ist die Emittentin nach § 6 (1
- Page 159 and 160:
(a) [alle Zusätzlichen Beträge, d
- Page 161 and 162:
Gebühren abzuziehen oder einzubeha
- Page 163 and 164:
§ 10 (VORLEGUNGSFRISTEN, VERJÄHRU
- Page 165 and 166:
sind, soweit nicht ein offenkundige
- Page 167 and 168:
(2) Die in Absatz (1) genannte Fäl
- Page 169 and 170:
ergebenden Verpflichtungen der Emit
- Page 171 and 172:
Teilschuldverschreibungen. Die Emit
- Page 173 and 174:
Muster - Endgültige Bedingungen Fo
- Page 175 and 176:
3 [Die Bedingungen dieser Endgülti
- Page 177 and 178:
7 Verzinsungsbeginn weitere Zinsvar
- Page 179 and 180:
Vorhergehende Feststellungstage zu
- Page 181 and 182:
16 Absicherungs Laufzeit 16 Protect
- Page 183 and 184:
Bedingungen, die nur für Teilschul
- Page 185 and 186:
Bedingungen, die nur für Teilschul
- Page 187 and 188:
Angepasster Vorzeitiger Rückzahlun
- Page 189 and 190:
22 Maßgebliches Auslösendes Ereig
- Page 191 and 192:
Business Day 190 Trans-European Aut
- Page 193 and 194:
35 Faktor 35 Factor Absicherungslau
- Page 195 and 196:
Bedingungen, die für alle Teilschu
- Page 197 and 198:
Festgelegte Währung Specified Curr
- Page 199 and 200:
Letzter Zulässiger Übertragungsta
- Page 201 and 202:
Referenzschuldner Reference Entity
- Page 203 and 204:
Durchführung einer syndizierten Em
- Page 205 and 206:
[Interessen von natürlichen oder j
- Page 207 and 208:
48 [Performance of Index/Formula/ot
- Page 209 and 210:
Commerzbank Aktiengesellschaft Hist
- Page 211 and 212:
Commercial Real Estate Germany/Comm
- Page 213 and 214:
Futher information on the holdings
- Page 215 and 216:
Federal Republic of Germany, who au
- Page 217 and 218:
Taxation Federal Republic of German
- Page 219 and 220:
tax liability depends on the applic
- Page 221 and 222:
tax-free private capital gain or ta
- Page 223 and 224:
Selling Restrictions 1 United State
- Page 225 and 226:
the competent authority in that Rel
- Page 227 and 228:
Documents Incorporated by Reference
- Page 229 and 230: Interim Report of the Commerzbank G
- Page 231 and 232: 230 Commerzbank Interim Report as o
- Page 233 and 234: 232 Commerzbank Interim Report as o
- Page 235 and 236: 234 Commerzbank Interim Report as o
- Page 237 and 238: 236 Commerzbank Interim Report as o
- Page 239 and 240: 238 Commerzbank Interim Report as o
- Page 241 and 242: 240 Commerzbank Interim Report as o
- Page 243 and 244: 242 Commerzbank Interim Report as o
- Page 245 and 246: 244 Commerzbank Interim Report as o
- Page 247 and 248: 246 Commerzbank Interim Report as o
- Page 249 and 250: 248 Commerzbank Interim Report as o
- Page 251 and 252: 250 Commerzbank Interim Report as o
- Page 253 and 254: 252 Commerzbank Interim Report as o
- Page 255 and 256: 254 Commerzbank Interim Report as o
- Page 257 and 258: 256 Commerzbank Interim Report as o
- Page 259 and 260: 258 Commerzbank Interim Report as o
- Page 261 and 262: 260 Commerzbank Interim Report as o
- Page 263 and 264: 262 Commerzbank Interim Report as o
- Page 265 and 266: 264 Commerzbank Interim Report as o
- Page 267 and 268: 2 Commerzbank Interim Report as of
- Page 269 and 270: 2 8 Commerzbank Interim Report as o
- Page 271 and 272: 270 Commerzbank Interim Report as o
- Page 273 and 274: 272 Commerzbank Interim Report as o
- Page 275 and 276: 274 Commerzbank Interim Report as o
- Page 277 and 278: 27 Commerzbank Interim Report as of
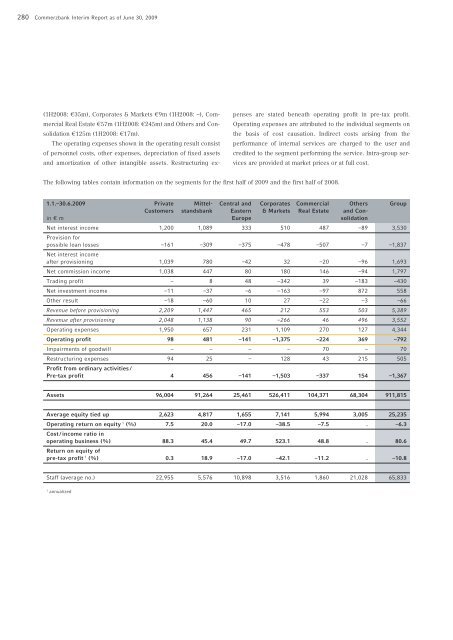
- Page 279: 278 Commerzbank Interim Report as o
- Page 283 and 284: 282 Commerzbank Interim Report as o
- Page 285 and 286: 284 Commerzbank Interim Report as o
- Page 287 and 288: 28 Commerzbank Interim Report as of
- Page 289 and 290: 288 Commerzbank Interim Report as o
- Page 291 and 292: 290 Commerzbank Interim Report as o
- Page 293 and 294: 292 Commerzbank Interim Report as o
- Page 295 and 296: 294 Commerzbank Interim Report as o
- Page 297 and 298: 29 Commerzbank Interim Report as of
- Page 299 and 300: Address List 1. Issuer 4. Legal Adv
- Page 301 and 302: The following non binding German la
- Page 303 and 304: Inhaltsverzeichnis Zusammenfassung
- Page 305 and 306: Risikofaktoren Der Erwerb von unter
- Page 307 and 308: Im Falle mehrerer Referenzschuldner
- Page 309 and 310: Darüber hinaus sollten Anleger bea
- Page 311 and 312: Funktion als die derzeitige auszuü
- Page 313 and 314: Kurs der Teilschuldverschreibungen
- Page 315 and 316: Teilschuldverschreibungen mit einem
- Page 317 and 318: Ziele, Erfahrungen bzw. Kenntnisse
- Page 319 and 320: Risiken aus der Integration der ehe
- Page 321 and 322: aufgrund von Verschlechterungen der
- Page 323 and 324: Es ist daher durchaus denkbar, dass
- Page 325 and 326: kommen, die sich erheblich negativ
- Page 327 and 328: werden zunehmend elektronisch abgew
- Page 329 and 330: Wichtige Information über diesen P
- Page 331 and 332:
Allgemeine Informationen Commerzban
- Page 333 and 334:
• die Teilschuldverschreibungen a
- Page 335 and 336:
dem Indexkorb und legen gegebenenfa
- Page 337 and 338:
Moody's S&P Fitch Rating Symbol (La
- Page 339 and 340:
Anleihebedingungen (Siehe zweisprac
- Page 341 and 342:
Commerzbank Aktiengesellschaft Gesc
- Page 343 and 344:
Corporates & Markets In diesem Segm
- Page 345 and 346:
Ausland BRE Bank SA, Warschau Comme
- Page 347 and 348:
Potenzielle Konflikte könnten aufg
- Page 349 and 350:
− die Aufgabe mehrerer Geschäfts
- Page 351 and 352:
Zusammenhang mit den Schuldverschre
- Page 353 and 354:
Finanzdienstleistungsinstitut, eine
- Page 355 and 356:
Schweizerische Umsatzabgabe bei der
- Page 357 and 358:
Darüber hinaus gilt Folgendes: 1.2
- Page 359 and 360:
vorherigen Zustimmung des bzw. der
- Page 361 and 362:
Per Verweis einbezogene Dokumente D
- Page 363:
Zwischenbericht des Commerzbank-Kon