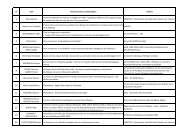
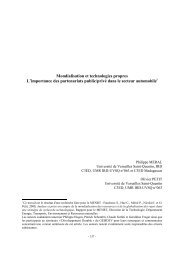
<strong>PRUD</strong> – <strong>projet</strong> n° <strong>37</strong> – <strong>rapport</strong> <strong>scientifique</strong> <strong>final</strong> (<strong>janvier</strong> 2004)Tableau A3 : Offre de travail selon la région, la zone de résidence, l’âge et le sexe– 10 ans et plus –Côte d’Ivoire 1985-19951985 1995Régions Âge Rural U rbain RuralUrbainHom- Fem- Hom- Fem- En s- Hom- Fem- Hom- Fem- Ens-10 – 29 ans 42,4 31,7 67,9 29,1 43,8 76,4 35,0 35,6 21,9 29,9Lagunes 30 – 49 ans 86,1 66, 7 92,5 54,7 73,3 100,0 77,8 93,5 69,6 83,050 ans et plus 52,0 34, 3 76,5 59,8 63,5 82,9 - 55,5 33,9 50,210 – 29 ans 48,9 52, 4 - - 51,0 14,3 25,0 66,7 50,0 <strong>37</strong>,4Sud-Comoé 30 – 49 ans 75,0 75, 7 - - 75,4 80,0 42,9 60,0 100,0 69,150 ans et plus 72,1 65, 4 - - 70,0 - 0,0 ,- 66,7 66,710 – 29 ans 77,8 66, 1 80,9 43,5 61,9 39,1 58,7 10,0 26,3 40,5Agnéby 30 – 49 ans 92,1 86, 9 64,7 69,9 77, 7 100,0 93,7 100,0 66,7 94,150 ans et plus 89,6 89, 9 76,9 94,2 88,2 70,6 75,0 33,3 50,0 67,3Haut- 10 – 29 ans 73,7 54, 0 58,5 41,2 57,9 44,1 72, 7 40,9 16,6 51,4Sassandra 30 – 49 ans 85,0 55, 6 89,7 54,8 69,9 100,0 87,1 100,0 24,9 89,950 ans et plus 59,2 62, 9 46,2 49,1 59,1 94,6 78, 6 100,0 - 87,810 – 29 ans 89,0 77, 6 31,8 11,6 69,2 87,4 77,5 45,7 57,3 68,9Savanes 30 – 49 ans 91,0 79, 4 83,5 44,1 80,7 100,0 97,9 72,3 89,7 93,850 ans et plus 84,9 82, 9 70,7 57,3 81,3 64,1 81, 5 84,5 75,5 74,3Vallée 10 – 29 ans 80,4 793 63,3 <strong>37</strong>,1 63,5 69,6 60,4 34,3 21,4 50,8Bandama 30 – 49 ans 96,9 88, 5 86,2 69,4 86,5 94,6 83, 0 87,7 63,3 83,650 ans et plus 95,5 90, 8 67,0 41,7 84,2 100,0 81,3 0,0 40,1 82,8Moyen- 10 – 29 ans 85,3 70, 3 73,2 26,4 66,8 85,9 96,9 333 16,7 64,5Comoé 30 – 49 ans 94,3 90, 1 89,5 34,5 74,7 100,0 100,0 87,5 63,6 85,950 ans et plus 864 68,5 71,3 58,6 72,8 87,8 100,0 - 100,0 83,610 – 29 ans 68,1 55,1 57,7 17,2 57,8 73,7 64,8 16,1 19,7 55,6Montagnes 30 – 49 ans 83,5 76,4 92,1 45,6 78,4 84,3 92,8 96,9 65,4 87,250 ans et plus 73,4 65,5 - - 70,5 71,7 67,4 20,0 42,9 66,710 – 29 ans 85,2 81,4 - - 83,3 51,2 53,2 64,9 32,1 51,1Lacs 30 – 49 ans 81,0 84,0 - - 83,0 100,0 100,0 100,0 72,6 90,250 ans et plus 82,3 96,1 - - 89,3 100,0 88,2 100,0 53,1 84,610 – 29 ans 83,7 82,6 62,9 42,3 74,7 71,2 72,6 - - 71,7Zanzan 30 – 49 ans 76,4 100,0 100,0 76,6 91,7 96,4 93,5 - - 94,750 ans et plus 69,7 78,1 75,8 100,074,7 95,5 72,3 - - 85,4Bas- 10 – 29 ans 791 68,8 - - 74,8 59,4 54,3 60,5 51,8 56,5Sassandra 30 – 49 ans 100,0 52,6 - - 69,7 100,0 84,2 100,0 71,3 93650 ans et plus 62,3 92,4 - - 72,7 64,2 33,5 100,0 60,2 53,0N’zi- 10 – 29 ans 84,9 80,1 69,4 47,973,0 64,5 69,9 28,6 25,0 57,3Comoé 30 – 49 ans 87,1 88,2 82,6 77,083,6 100,0 100,0 100,0 66,7 95,450 ans et plus 94,1 92,6 70,1 81,687,8 100,0 65,4 100,0 0,0 70,610 – 29 ans 69,5 71,4 65,9 27,467,1 47,5 82,1 62,8 24,1 51,1Marahoué 30 – 49 ans 91,7 83,2 100,0 46,084,6 100,0 100,0 94,3 82,2 95,250 ans et plus 73,2 86,1 100,0 64,174,1 90,5 100,0 41,2 77,7 76,4Woro- 10 – 29 ans 88,5 90,7 - - 87,2 53,9 20,6 - - <strong>37</strong>,7dougou 30 – 49 ans 100,0 91,9 - - 94,5 94,6 100,0 - - 95950 ans et plus 79,4 64,4 - - 84,1 49,1 - - - 42,010 – 29 ans - - - - - 66,7 70,0 55,6 4,3 38,3Denguélé 30 – 49 ans - - - - - 100,0 100,0 80,0 40,0 80,950 ans et plus - - - - - 80,0 83,3 - 0,0 75,5Sud- 10 – 29 ans 58,2 64,6 56,9 25,953,7 48,7 32,9 25,0 70,0 43,7Bandama 30 – 49 ans 70,7 86,8 78,7 29,964,7 97,6 92,4 100,0 66,7 94,450 ans et plus 78,1 73,9 81,2 100,081,6 84,3 72,7 50,0 - 77,5Ensemble Ensemble 78,8 73,9 75,9 41,969,0 75,8 71,5 59,6 38,5 60,5N pondéré 2162 2387 1668 1825 8042 964 898 892 997 <strong>37</strong>51Source : A partir des données de l’ENVM 1995 – Pondération normalisée.106
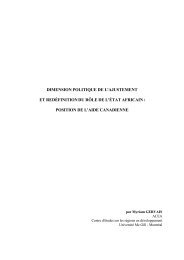
<strong>PRUD</strong> – <strong>projet</strong> n° <strong>37</strong> – <strong>rapport</strong> <strong>scientifique</strong> <strong>final</strong> (<strong>janvier</strong> 2004)Tableau A4 : Taux de chômage selon la région, la zone de résidence, l’âge et le sexe – 10 ans et plus –Côte d’Ivoire 1985-199519851995Régions Âge Rural Urbain Rura l UrbainHom- Fem- Hom- Fem- Ens- Hom- Fem- Hom- Fem-Ens-10 – 29 ans 0,0 0, 0 22,8 7,6 12,5 0,0 0, 0 16,1 13,012,7Lagunes 30 – 49 ans 0,0 0, 0 8,7 2,1 5,0 0,0 0, 0 11,8 4,88,050 ans et plus 0,0 0, 0 6,8 0,0 2,9 0,0 0, 0 5,5 43, 1 13,710 – 29 ans 0,0 0, 0 - - 0,0 0,0 0, 0 0,0 0,00,0Sud-Comoé 30 – 49 ans 0,0 0, 0 - - 0,0 0,0 0, 0 0,0 50,017,850 ans et plus 0,0 0, 0 - - 0,0 0,0 - - 50,031,110 – 29 ans 0,0 0, 0 4,5 0,6 1,1 0,0 7, 4 0,0 0,03,3Agnéby 30 – 49 ans 0,0 0, 0 0,0 0,0 0,0 9,7 0, 0 0,0 0,04,150 ans et plus 0,0 0, 0 0,0 0,0 0,0 25, 0 50, 0 0,0 0,033,8Haut- 10 – 29 ans 0,2 0, 0 0,0 0,0 0,0 0,0 0, 0 0,0 0,00,0Sassandra 30 – 49 ans 0,0 0, 0 0,0 0,0 0,0 6,6 3, 4 0,0 0,04,450 ans et plus 0,0 0, 0 0,0 0,0 00 3,4 2, 3 39,9 - 5,310 – 29 ans 0,0 0, 0 0,0 0,0 0,0 0,0 0, 0 0,0 6,81,3Savanes 30 – 49 ans 0,0 0, 0 0,0 0,0 0,6 0,0 0, 0 0,0 0,00,050 ans et plus 0,0 0, 0 0,0 0,0 0,0 0,0 0, 0 0,0 0,00,0Vallée 10 – 29 ans 0,0 0, 0 7,8 3,2 3,0 0,0 0, 0 11,2 26,13,5Bandama 30 – 49 ans 0,0 0, 0 0,0 0,0 0,0 5,1 0, 0 0,0 6,32,350 ans et plus 0,0 0, 0 0,0 0,0 0,0 0,0 0, 0 - 0,00,0Moyen- 10 – 29 ans 0,0 0, 0 3,0 0,0 0,6 3,5 6, 9 14,3 33,<strong>37</strong>,6Comoé 30 – 49 ans 0,0 0, 0 0,0 0,0 0,0 0,0 9, 0 0,0 14,36,450 ans et plus 0,0 0, 0 0,0 0,0 0,0 0,0 0, 0 - 0, 0 0,010 – 29 ans 0,0 0, 0 7,0 00 0,3 0,0 0, 0 11,1 7,20,7Montagnes 30 – 49 ans 0,0 0, 0 9,0 0,0 0,8 0,0 0, 0 3,2 0,00,450 ans et plus 0,0 0, 0 0,0 - 0,0 0,0 0, 0 0,0 0,00,010 – 29 ans 0,0 0, 0 - - 0,0 9,2 6, 1 23,0 17,114,3Lacs 30 – 49 ans 0,0 0, 0 - - 0,0 0,0 0, 0 19,8 0,06,150 ans et plus 0,0 0, 0 - - 0,0 0,0 0, 0 0,0 0,00,010 – 29 ans 0,8 0, 0 9,3 0,0 1,2 0,0 2, 0 - - 0,8Zanzan 30 – 49 ans 0,0 0, 0 0,0 0,0 0,0 0,0 0, 0 - - 0,050 ans et plus 0,0 0, 0 0,0 0,0 0,0 8,9 7, 2 - - 8,3Bas- 10 – 29 ans 0,0 0, 0 - - 0,0 0,0 0, 0 23,4 0,06,6Sassandra 30 – 49 ans 0,0 0, 0 - - 0,0 3,3 0, 0 14,2 0,05,350 ans et plus 0,0 0, 0 - - 0,0 17, 7 0, 0 0,0 66,217,1N’zi- 10 – 29 ans 0,0 1, 5 4,0 0,0 1,0 0,0 0, 0 0,0 50,02,8Comoé 30 – 49 ans 0,0 0, 0 0,0 0,0 0,0 0,0 0, 0 0,0 0,00,050 ans et plus 0,0 0, 0 0,0 0,0 0,0 0,0 0, 0 0,0 - 0,010 – 29 ans 0,0 0, 0 0,0 0,0 0,0 0,0 0, 0 8,2 0,02,8Marahoué 30 – 49 ans 0,0 0, 0 0,0 0,0 0,0 0,0 0, 0 0,0 0,00,050 ans et plus 0,0 0, 0 0,0 0,0 0,0 0,0 0, 0 0,0 0,00,0Woro- 10 – 29 ans 0,0 0, 0 - - 0,0 0,0 0, 0 - - 0,0dougou 30 – 49 ans 0,0 0, 0 - - 0,0 0,0 0, 0 - - 0,050 ans et plus 0,0 0, 0 - - 0,0 0,0 - - - 0,010 – 29 ans - - - - - 0,0 0, 0 0,0 0,00,0Denguélé 30 – 49 ans - - - - - 0,0 0, 0 0,0 0,00,050 ans et plus - - - - - 0,0 0, 0 - - 0,0Sud- 10 – 29 ans 0,0 0, 0 0, 0 0,0 0,0 3,4 0, 0 0,0 0,01,7Bandama 30 – 49 ans 0,0 0, 0 0, 0 0,0 0,0 0,0 0, 0 0,0 0,00,050 ans et plus 0,0 0, 0 0, 0 0,0 0,0 4,1 10, 9 0,0 - 6,7Ensemble Ensemble 0,0 0,1 9,3 3,1 2,3 2,0 1, 8 10,5 8,85,0N pondéré 2162 2387 1668 1825 8042 964 898 892 997 <strong>37</strong>51Source : A partir des données de l’ENVM 1995 – Pondération normalisée.107
- Page 1:
PRUD - projet n° 37 - rapport scie
- Page 4:
PRUD - projet n° 37 - rapport scie
- Page 8 and 9:
PRUD - projet n° 37 - rapport scie
- Page 10 and 11:
PRUD - projet n° 37 - rapport scie
- Page 12 and 13:
PRUD - projet n° 37 - rapport scie
- Page 14 and 15:
PRUD - projet n° 37 - rapport scie
- Page 16 and 17:
PRUD - projet n° 37 - rapport scie
- Page 18 and 19:
PRUD - projet n° 37 - rapport scie
- Page 20 and 21:
PRUD - projet n° 37 - rapport scie
- Page 22 and 23:
PRUD - projet n° 37 - rapport scie
- Page 24 and 25:
PRUD - projet n° 37 - rapport scie
- Page 26 and 27:
PRUD - projet n° 37 - rapport scie
- Page 28 and 29:
PRUD - projet n° 37 - rapport scie
- Page 30 and 31:
PRUD - projet n° 37 - rapport scie
- Page 32 and 33:
PRUD - projet n° 37 - rapport scie
- Page 34 and 35:
PRUD - projet n° 37 - rapport scie
- Page 36 and 37:
PRUD - projet n° 37 - rapport scie
- Page 38 and 39:
PRUD - projet n° 37 - rapport scie
- Page 40 and 41:
PRUD - projet n° 37 - rapport scie
- Page 42 and 43:
PRUD - projet n° 37 - rapport scie
- Page 44 and 45:
PRUD - projet n° 37 - rapport scie
- Page 46 and 47:
PRUD - projet n° 37 - rapport scie
- Page 48 and 49:
PRUD - projet n° 37 - rapport scie
- Page 50 and 51:
PRUD - projet n° 37 - rapport scie
- Page 52 and 53:
PRUD - projet n° 37 - rapport scie
- Page 54 and 55:
PRUD - projet n° 37 - rapport scie
- Page 56 and 57:
PRUD - projet n° 37 - rapport scie
- Page 58 and 59: 12PRUD - projet n° 37 - rapport sc
- Page 60 and 61: PRUD - projet n° 37 - rapport scie
- Page 62 and 63: PRUD - projet n° 37 - rapport scie
- Page 64 and 65: PRUD - projet n° 37 - rapport scie
- Page 66 and 67: PRUD - projet n° 37 - rapport scie
- Page 68 and 69: PRUD - projet n° 37 - rapport scie
- Page 70 and 71: PRUD - projet n° 37 - rapport scie
- Page 72 and 73: PRUD - projet n° 37 - rapport scie
- Page 74 and 75: PRUD - projet n° 37 - rapport scie
- Page 76 and 77: PRUD - projet n° 37 - rapport scie
- Page 78 and 79: PRUD - projet n° 37 - rapport scie
- Page 80 and 81: PRUD - projet n° 37 - rapport scie
- Page 82 and 83: PRUD - projet n° 37 - rapport scie
- Page 84 and 85: PRUD - projet n° 37 - rapport scie
- Page 86 and 87: PRUD - projet n° 37 - rapport scie
- Page 88 and 89: PRUD - projet n° 37 - rapport scie
- Page 90 and 91: PRUD - projet n° 37 - rapport scie
- Page 92 and 93: PRUD - projet n° 37 - rapport scie
- Page 94 and 95: PRUD - projet n° 37 - rapport scie
- Page 96 and 97: PRUD - projet n° 37 - rapport scie
- Page 98 and 99: PRUD - projet n° 37 - rapport scie
- Page 100 and 101: PRUD - projet n° 37 - rapport scie
- Page 102 and 103: PRUD - projet n° 37 - rapport scie
- Page 104 and 105: PRUD - projet n° 37 - rapport scie
- Page 106 and 107: PRUD - projet n° 37 - rapport scie
- Page 110 and 111: PRUD - projet n° 37 - rapport scie
- Page 112 and 113: Chapitre IILA CENTRALITE(RESEAU URB
- Page 114 and 115: LE RESEAU URBAIN DU MALIGuy Pourcet
- Page 116 and 117: - Distinguer l'influence des facteu
- Page 118 and 119: §1- L'existence d'un lien entre le
- Page 120 and 121: Graphe N° 1 : Ecarts entre les eff
- Page 122 and 123: Graphe N° 3 : Indicateurs de spéc
- Page 124 and 125: dans les 50 cercles puis dans les 1
- Page 126 and 127: Le calcul des écarts et du Khi² c
- Page 128 and 129: I- EVALUATION DES CAPACITES D'EXPOR
- Page 130 and 131: Le graphe N° 10, qui représente l
- Page 132 and 133: Appariement des flux d'échanges in
- Page 134 and 135: transport interurbains. Ce travail
- Page 136 and 137: (δu , δr) dBS >= CE= C° + CT(EA)
- Page 138 and 139: Annexe N° 1EVALUATION DES PRODUCTI
- Page 140 and 141: Cadre de cohérenceT blσ bl = σ b
- Page 142 and 143: locales du centre l. Cela permet de
- Page 144 and 145: 143
- Page 146 and 147: ECHANGES TRANSFRONTALIERS ENTRE LA
- Page 148 and 149: Situées aux frontières, les princ
- Page 150 and 151: 1.3 Données ethniques et fragmenta
- Page 152 and 153: espaces d’échanges, des espaces
- Page 154 and 155: d’opportunité qu’offre ces der
- Page 156 and 157: sont non seulement les commerçants
- Page 158 and 159:
Tableaux 3: Volume des produits agr
- Page 160 and 161:
loi du marché, des distances et de
- Page 162 and 163:
Prix des produits manufacturés de
- Page 164 and 165:
La zone frontalière est objet d’
- Page 166 and 167:
échapper aux contrôles des forces
- Page 168 and 169:
Faso. Ces deux voies importantes lu
- Page 170 and 171:
les populations communes de la Côt
- Page 172 and 173:
LE SYSTEME DES PLACES DE MARCHE DAN
- Page 174 and 175:
* en produits de cueillette, de cha
- Page 176 and 177:
trans-frontaliers et l’orpaillage
- Page 178 and 179:
Ces 43 marchés hebdomadaires sont
- Page 180 and 181:
D. Les fonctionsLes marchés de la
- Page 182 and 183:
concertées destinées à améliore
- Page 184 and 185:
Ces dispositions s’articuleront a
- Page 186 and 187:
détail pour faire des bénéfices.
- Page 188 and 189:
- de la gestion de façon durable d
- Page 190 and 191:
ANNEXE 2- RESULTAT DES ENQUETESProf
- Page 192 and 193:
LE SYSTEME DES PLACES DE MARCHE DE
- Page 194 and 195:
déplacent en utilisant les sotrama
- Page 196 and 197:
la mairie du District, la BHM et la
- Page 198 and 199:
l’Etat a reconstruit 412 places d
- Page 200 and 201:
2. L’analyse des facteurs de loca
- Page 202 and 203:
Les épouses qui exercent une activ
- Page 204 and 205:
Les questions de l’enquête ont p
- Page 206 and 207:
ConclusionAu terme de cette étude,
- Page 208 and 209:
Chapitre IIILA GOUVERNANCE(Gestion
- Page 210 and 211:
LE FINANCEMENT DU SERVICE DES DECHE
- Page 212 and 213:
2001 : 551 milliersd’eurosAccra M
- Page 214 and 215:
1 - Ouagadougou et Bobo-DioulassoAN
- Page 216 and 217:
mondiale (Accra a été réintégr
- Page 218 and 219:
Rétrospectivement, la mise en plac
- Page 220 and 221:
LA GESTION DES ORDURES MENAGERES A
- Page 222 and 223:
1-1- L’organisation du secteur de
- Page 224 and 225:
Selon Adam Smith, les services coll
- Page 226 and 227:
financé par les propriétaires de
- Page 228 and 229:
Tout d’abord, il est vrai et dit
- Page 230 and 231:
fontaines etc. Sur les 420 employé
- Page 232 and 233:
la communauté qui désire réalise
- Page 234 and 235:
Voisinage 33 22,6Compétences techn
- Page 236 and 237:
ecruter d'autres afin d'assurer le
- Page 238 and 239:
En plus, comme il n’existe aucun
- Page 240 and 241:
s’annonce très difficile tant qu
- Page 242 and 243:
DECENTRALISATION ET ACCES AUX RESSO
- Page 244 and 245:
- la taxe sur les carrières et l
- Page 246 and 247:
Tableau n° 2 : Evolution des impô
- Page 248 and 249:
Désignation Prévisions Réalisati
- Page 250 and 251:
Yirimadio.7.009 habitantsSource : R
- Page 252 and 253:
Les activités professionnelles rep
- Page 254 and 255:
PrévisionsF CFARéalisationF CFATa
- Page 256 and 257:
Au niveau du District, les difficul
- Page 258 and 259:
Source : Compte administratif de la