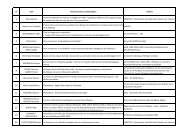
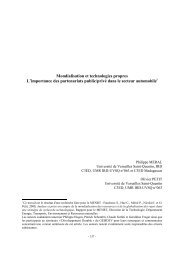
<strong>PRUD</strong> – <strong>projet</strong> n° <strong>37</strong> – <strong>rapport</strong> <strong>scientifique</strong> <strong>final</strong> (<strong>janvier</strong> 2004)Tableau A5 : Evolution de la part des dépenses alimentaires dans le budget des ménages –Côte d’Ivoire 1985-1995Ensemble Côte d’IvoireDépensesTotalesFCFA1985 1995DépensesAuto-Dépenses DépensesAuto-Alimentsconso. N To tales Alimentsconso.% %FCFA%%Lagunes 393446 46,22 1, 5 393 389134 44,1 1,4 300Sud-Comoé 217154 57,49 13,0 69 309505 54, 0 3,5 20Agnéby 156<strong>37</strong>6 48,59 15, 2 54 312523 56,8 18,2 30Haut-Sassandra 188188 55,67 16, 3 111 273864 58,3 21,1 80Savanes 157062 57,86 26, 8 134 205488 61,3 18,5 60Vallée Bandama 340704 48,39 12, 9 145 291776 55,9 13,9 100Moyen-Comoé 173170 48,29 11, 6 63 297872 58,4 19,1 3018 Montagnes 206348 60,74 24, 0 147 228261 50,2 21,7 80Lacs 147976 60,65 22, 9 32 203262 50,0 13,0 40Zanzan 114744 58,6 <strong>37</strong>, 4 65 245249 65,9 30,5 50Bas-Sassandra 183625 56,65 25, 8 31 263558 58,4 14,1 50N'zi-Comoé 130285 56,92 27, 3 88 155484 56,8 19,4 30Marahoué 175339 61,02 28, 6 124 284758 51,3 14,6 40Worodougou 129005 59,14 31, 5 62 281231 56,2 17,2 20Denguélé - - - - 227896 56,1 16,8 20Sud-Bandama 198254 57,43 31, 1 70 248529 59,7 25,3 50Ensemble 241545 53,81 16, 6 1588 295154 52,9 12,6 1000UrbainLagunes 408540 45,4 2, 3 368 414545 42,4 0,4 260Sud-Comoé - - - - 349656 51,7 0,0 10Agnéby 173243 45, 1 2, 2 29 368781 49,3 0,3 10Haut-Sassandra 227424 47, 8 2, 4 31 334935 57,4 0,2 20Savanes 215347 42, 4 2, 1 29 163836 58,9 8,2 20Vallée Bandama 505839 40,0 2, 0 84 31<strong>37</strong>30 48,1 3, 3 40Moyen-Comoé 194753 46,0 2, 3 <strong>37</strong> 359879 53,5 3, 0 1018 Montagnes 344209 44,7 2, 2 18 280585 38,5 1, 2 20Lacs - - - - 181707 49,6 2,2 20Zanzan 168156 47, 9 2, 4 16- - - -Bas-Sassandra - - - - 311311 56,9 2,5 20N'zi-Comoé 183175 40,8 2, 0 38 244456 52,8 0,0 10Marahoué 233<strong>37</strong>1 46,9 2, 3 14 340847 51,5 2,4 20Worodougou - - - - - - - -Denguélé - - - - 259632 48,7 0,0 10Sud-Bandama 342904 41,5 2,1 15 244218 55,9 8,3 10Ensemble 356963 44,5 2, 2 680 355962 46,5 1,3 480RuralLagunes 168613 58, 2 21, 6 25 223963 54,9 9, 8 40Sud-Comoé 217154 57, 5 13, 0 69 269353 56,3 7, 4 10Agnéby 136234 52, 8 23, 6 25 284394 60,5 29,0 20Haut-Sassandra 172896 58, 7 23, 4 80 253507 58,6 28,2 60Savanes 140709 62, 2 35, 9 105 226315 62,6 23,9 40Vallée Bandama 116644 59,9 32, 7 62 277139 61,1 22,4 60Moyen-Comoé 142305 51,5 23, 5 26 266868 60,8 28,1 2018 Montagnes 186615 63,0 28, 4 129 210820 54,1 30,6 60Lacs 147976 60,7 22, 9 32 224817 50,4 23,8 20Zanzan 96910 62,2 47, 8 49 245249 65,9 30,5 50Bas-Sassandra 183625 56,7 25,8 31 231722 59, 4 22,2 30N'zi-Comoé 90186 69,2 50,3 50 110998 58,8 30,2 20Marahoué 168070 62,8 32,3 111 228670 51,1 26,7 20Worodougou 129005 59,1 31,5 62 281231 56,2 17,2 20Denguélé - - - - 196160 63,5 38,1 10Sud-Bandama 158790 61,8 40,7 55 249606 60,6 29,9 40Ensemble 155108 60,8 30,6 908 239023 58,8 25,3 520A partir des données de l’EPAM 1985 et de l’ENVM 1995 – Pondération normaliséeN108
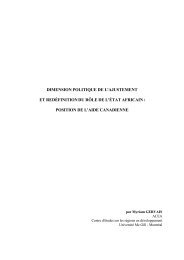
<strong>PRUD</strong> – <strong>projet</strong> n° <strong>37</strong> – <strong>rapport</strong> <strong>scientifique</strong> <strong>final</strong> (<strong>janvier</strong> 2004)Annexe A6 : Coefficients de régression des déterminants du niveau de vie des ménages –effet seuil d’urbanisation - Côte d’Ivoire 1995ConstantePAUVRES NON PAUVRES ENS EMBLET Sig TββT Sig T T Sig Tβ5, 0046 77, 841 0,0000 5, 6043 120,428 0, 0000 5,4735 100,813 0,0000Caractéristiques des ménagesAge du chef 0,0000 0, 074 0,9407 0,0008 1, 445 0, 1488 0, 0009 1,484 0, 1380Sexe du chef – Homme -0,0176 -0,767 0,4438 -0,0051 - 0,282 0, 7777 -0,0200 -1,029 0,30352Nationalité - Ivo irienne0 ,0471 2,022 0,0443 0,0143 0,747 0,4551 0, 0613 3,041 0,0024Agriculteur progre ssif 3 0 ,0505 0, 901 0,3687 0,0<strong>37</strong>4 0, 991 0, 3221 0, 0734 1,760 0,0787Agriculteur de su bsistance 0,0018 0,041 0,9675 -0,0507 -1,642 0, 1010 -0,1155 -3,448 0,0006In dépendant ave c capital0 ,0566 1,067 0,2873 -0,0<strong>37</strong>0 -1,159 0, 2470 0 ,0083 0, 233 0,8159Indépendant marg inal 0 ,0367 0, 787 0,4321 -0,1025 -3,335 0, 0009 -0,1138 -3,<strong>37</strong>6 0,0008Salarié non protégé 0,0290 0, 482 0,6301 0,1081 3, 255 0, 0012 0, 1549 4,134 0,0000Salar ié protégé -0,0081 -0,116 0,9079 -0,0116 -0,325 0, 7454 0, 0263 0,648 0,5169Taille du m énage -0,0039 -1,480 0,1401 -0,0300 -13,464 0,0000 -0,0395 -18,196 0,0000Caractéristiquesrégionales4Agricole -0,0734 -2,078 0,0388 0,0111 0, 361 0, 7180 -0,845 0,3984 -0,0267Anciennement tertiaire 0, 0583 0,563 0,5740 0,0681 1, 223 0, 2217 1,785 0,0746 0,1099En tertiari sation -0,0091 -0,327 0,7440 -0,0450 -1,808 0, 0710 - 2,641 0,0084 -0,06705IES Faible -0,0755 -0,738 0,4613 0,0096 0, 185 0, 8531 -0,631 0,5281 -0,0368IE S Moyen -0,0012 -0,048 0,9619 0,0430 1, 730 0, 0840 1,012 0,3118 0,0243Pauvre 6 - - - -0,0984 -3,103 0, 0020 - - -In termédiaire 0 ,0028 0, 115 0,9083 -0,0369 -1,329 0, 1842 2,978 0,0030 0, 0691Taux d’urbanisation -0,0083 -0,235 0,8145 - - - 2,906 0,00<strong>37</strong> 0,0928Zone d e résidence – Urbaine 8 0,0349 1, 256 0,2102 0,0780 3, 819 0, 0001 2,947 0,0033 0,0650R 2 -ajusté 0, 6 27, 2 36,0F (Sign) 1,09203 (0,3610) 16,46605 (0, 0000)32,27455 (0,0000)N 254 726 1000(1)Base = Fem me ; (2) Base = Etrangers ; ( 3) Ba se = Chômeurs et inact ifs ; (4) Base = Régions industrielles ; (5) Base = IES –infrastructures économiques et sociales - élevée s ; (6) Base = Régions riches ; ( 7) Base = Régions dont l e taux d’urbanisation est inférieur à60% ; (8) Base = Rurale.Source : A partir des données de l’EPAM 1985 et de l’ENVM 1995 – Pondération normalisée109
- Page 1:
PRUD - projet n° 37 - rapport scie
- Page 4:
PRUD - projet n° 37 - rapport scie
- Page 8 and 9:
PRUD - projet n° 37 - rapport scie
- Page 10 and 11:
PRUD - projet n° 37 - rapport scie
- Page 12 and 13:
PRUD - projet n° 37 - rapport scie
- Page 14 and 15:
PRUD - projet n° 37 - rapport scie
- Page 16 and 17:
PRUD - projet n° 37 - rapport scie
- Page 18 and 19:
PRUD - projet n° 37 - rapport scie
- Page 20 and 21:
PRUD - projet n° 37 - rapport scie
- Page 22 and 23:
PRUD - projet n° 37 - rapport scie
- Page 24 and 25:
PRUD - projet n° 37 - rapport scie
- Page 26 and 27:
PRUD - projet n° 37 - rapport scie
- Page 28 and 29:
PRUD - projet n° 37 - rapport scie
- Page 30 and 31:
PRUD - projet n° 37 - rapport scie
- Page 32 and 33:
PRUD - projet n° 37 - rapport scie
- Page 34 and 35:
PRUD - projet n° 37 - rapport scie
- Page 36 and 37:
PRUD - projet n° 37 - rapport scie
- Page 38 and 39:
PRUD - projet n° 37 - rapport scie
- Page 40 and 41:
PRUD - projet n° 37 - rapport scie
- Page 42 and 43:
PRUD - projet n° 37 - rapport scie
- Page 44 and 45:
PRUD - projet n° 37 - rapport scie
- Page 46 and 47:
PRUD - projet n° 37 - rapport scie
- Page 48 and 49:
PRUD - projet n° 37 - rapport scie
- Page 50 and 51:
PRUD - projet n° 37 - rapport scie
- Page 52 and 53:
PRUD - projet n° 37 - rapport scie
- Page 54 and 55:
PRUD - projet n° 37 - rapport scie
- Page 56 and 57:
PRUD - projet n° 37 - rapport scie
- Page 58 and 59:
12PRUD - projet n° 37 - rapport sc
- Page 60 and 61: PRUD - projet n° 37 - rapport scie
- Page 62 and 63: PRUD - projet n° 37 - rapport scie
- Page 64 and 65: PRUD - projet n° 37 - rapport scie
- Page 66 and 67: PRUD - projet n° 37 - rapport scie
- Page 68 and 69: PRUD - projet n° 37 - rapport scie
- Page 70 and 71: PRUD - projet n° 37 - rapport scie
- Page 72 and 73: PRUD - projet n° 37 - rapport scie
- Page 74 and 75: PRUD - projet n° 37 - rapport scie
- Page 76 and 77: PRUD - projet n° 37 - rapport scie
- Page 78 and 79: PRUD - projet n° 37 - rapport scie
- Page 80 and 81: PRUD - projet n° 37 - rapport scie
- Page 82 and 83: PRUD - projet n° 37 - rapport scie
- Page 84 and 85: PRUD - projet n° 37 - rapport scie
- Page 86 and 87: PRUD - projet n° 37 - rapport scie
- Page 88 and 89: PRUD - projet n° 37 - rapport scie
- Page 90 and 91: PRUD - projet n° 37 - rapport scie
- Page 92 and 93: PRUD - projet n° 37 - rapport scie
- Page 94 and 95: PRUD - projet n° 37 - rapport scie
- Page 96 and 97: PRUD - projet n° 37 - rapport scie
- Page 98 and 99: PRUD - projet n° 37 - rapport scie
- Page 100 and 101: PRUD - projet n° 37 - rapport scie
- Page 102 and 103: PRUD - projet n° 37 - rapport scie
- Page 104 and 105: PRUD - projet n° 37 - rapport scie
- Page 106 and 107: PRUD - projet n° 37 - rapport scie
- Page 108 and 109: PRUD - projet n° 37 - rapport scie
- Page 112 and 113: Chapitre IILA CENTRALITE(RESEAU URB
- Page 114 and 115: LE RESEAU URBAIN DU MALIGuy Pourcet
- Page 116 and 117: - Distinguer l'influence des facteu
- Page 118 and 119: §1- L'existence d'un lien entre le
- Page 120 and 121: Graphe N° 1 : Ecarts entre les eff
- Page 122 and 123: Graphe N° 3 : Indicateurs de spéc
- Page 124 and 125: dans les 50 cercles puis dans les 1
- Page 126 and 127: Le calcul des écarts et du Khi² c
- Page 128 and 129: I- EVALUATION DES CAPACITES D'EXPOR
- Page 130 and 131: Le graphe N° 10, qui représente l
- Page 132 and 133: Appariement des flux d'échanges in
- Page 134 and 135: transport interurbains. Ce travail
- Page 136 and 137: (δu , δr) dBS >= CE= C° + CT(EA)
- Page 138 and 139: Annexe N° 1EVALUATION DES PRODUCTI
- Page 140 and 141: Cadre de cohérenceT blσ bl = σ b
- Page 142 and 143: locales du centre l. Cela permet de
- Page 144 and 145: 143
- Page 146 and 147: ECHANGES TRANSFRONTALIERS ENTRE LA
- Page 148 and 149: Situées aux frontières, les princ
- Page 150 and 151: 1.3 Données ethniques et fragmenta
- Page 152 and 153: espaces d’échanges, des espaces
- Page 154 and 155: d’opportunité qu’offre ces der
- Page 156 and 157: sont non seulement les commerçants
- Page 158 and 159: Tableaux 3: Volume des produits agr
- Page 160 and 161:
loi du marché, des distances et de
- Page 162 and 163:
Prix des produits manufacturés de
- Page 164 and 165:
La zone frontalière est objet d’
- Page 166 and 167:
échapper aux contrôles des forces
- Page 168 and 169:
Faso. Ces deux voies importantes lu
- Page 170 and 171:
les populations communes de la Côt
- Page 172 and 173:
LE SYSTEME DES PLACES DE MARCHE DAN
- Page 174 and 175:
* en produits de cueillette, de cha
- Page 176 and 177:
trans-frontaliers et l’orpaillage
- Page 178 and 179:
Ces 43 marchés hebdomadaires sont
- Page 180 and 181:
D. Les fonctionsLes marchés de la
- Page 182 and 183:
concertées destinées à améliore
- Page 184 and 185:
Ces dispositions s’articuleront a
- Page 186 and 187:
détail pour faire des bénéfices.
- Page 188 and 189:
- de la gestion de façon durable d
- Page 190 and 191:
ANNEXE 2- RESULTAT DES ENQUETESProf
- Page 192 and 193:
LE SYSTEME DES PLACES DE MARCHE DE
- Page 194 and 195:
déplacent en utilisant les sotrama
- Page 196 and 197:
la mairie du District, la BHM et la
- Page 198 and 199:
l’Etat a reconstruit 412 places d
- Page 200 and 201:
2. L’analyse des facteurs de loca
- Page 202 and 203:
Les épouses qui exercent une activ
- Page 204 and 205:
Les questions de l’enquête ont p
- Page 206 and 207:
ConclusionAu terme de cette étude,
- Page 208 and 209:
Chapitre IIILA GOUVERNANCE(Gestion
- Page 210 and 211:
LE FINANCEMENT DU SERVICE DES DECHE
- Page 212 and 213:
2001 : 551 milliersd’eurosAccra M
- Page 214 and 215:
1 - Ouagadougou et Bobo-DioulassoAN
- Page 216 and 217:
mondiale (Accra a été réintégr
- Page 218 and 219:
Rétrospectivement, la mise en plac
- Page 220 and 221:
LA GESTION DES ORDURES MENAGERES A
- Page 222 and 223:
1-1- L’organisation du secteur de
- Page 224 and 225:
Selon Adam Smith, les services coll
- Page 226 and 227:
financé par les propriétaires de
- Page 228 and 229:
Tout d’abord, il est vrai et dit
- Page 230 and 231:
fontaines etc. Sur les 420 employé
- Page 232 and 233:
la communauté qui désire réalise
- Page 234 and 235:
Voisinage 33 22,6Compétences techn
- Page 236 and 237:
ecruter d'autres afin d'assurer le
- Page 238 and 239:
En plus, comme il n’existe aucun
- Page 240 and 241:
s’annonce très difficile tant qu
- Page 242 and 243:
DECENTRALISATION ET ACCES AUX RESSO
- Page 244 and 245:
- la taxe sur les carrières et l
- Page 246 and 247:
Tableau n° 2 : Evolution des impô
- Page 248 and 249:
Désignation Prévisions Réalisati
- Page 250 and 251:
Yirimadio.7.009 habitantsSource : R
- Page 252 and 253:
Les activités professionnelles rep
- Page 254 and 255:
PrévisionsF CFARéalisationF CFATa
- Page 256 and 257:
Au niveau du District, les difficul
- Page 258 and 259:
Source : Compte administratif de la