PRUD â projet n° 37 â rapport scientifique final (janvier ... - gemdev
PRUD â projet n° 37 â rapport scientifique final (janvier ... - gemdev
PRUD â projet n° 37 â rapport scientifique final (janvier ... - gemdev
- No tags were found...

You also want an ePaper? Increase the reach of your titles
YUMPU automatically turns print PDFs into web optimized ePapers that Google loves.
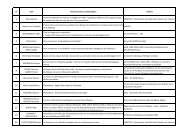
<strong>PRUD</strong> – <strong>projet</strong> n° <strong>37</strong> – <strong>rapport</strong> <strong>scientifique</strong> <strong>final</strong> (<strong>janvier</strong> 2004)Annex 2. Classification des activités informelles urbaines : moyenne des variables (1)Segment sup. Segment inf. 2 Segment inf. 1 EnsembleVariables de classificationForme juridiqueGérant de l'établ.Propriétair e ou associé0.1800.8200.0530.9470.1310.8690.1260.874Compte bancaire 0.2<strong>37</strong> 0.075 0.083 0.131LocalLocal dur 0.651 0.000 0.135 0.265Local semi-durLocal non dur0.3420.0070.0001.0000.1260.7390.1620.574Taille1 à 2 personnes3 à 4 personnes0.4890.3540.6930.2<strong>37</strong>1.0000.0020.7520.1795 à 9 personnes 0.136 0.070 0.000 0.06310 pers. et plus 0.021 0.000 0.000 0.007Proportion salariés > 0 0.<strong>37</strong>5 0.134 0.033 0.171S uivi une formation prof. 0.543 0.553 0.056 0.347Branches d'activitéProd Bois 0.056 0.053 0.000 0.032Prod Textile 0.089 0.042 0.000 0.040Prod AutresCommerce0.1220.2480.1280.3830.0001.0000.0740.591Serv Répar. 0.115 0.120 0.000 0.069Serv Autres 0.<strong>37</strong>0 0.274 0.000 0.193N 427 358 540 1325Variables descriptivesLocalisation urbaineSan Pedro 0.274 0.103 0.1<strong>37</strong> 0.172Daloa 0.213 0.313 0.187 0.229KorhogoOdienné0.2180.1520.2090.1790.1780.2610.1990.204Bondoukou 0.143 0.196 0.2<strong>37</strong> 0.195Caractéristiques du chef d'établissementIvoirien 0.717 0.740 0.643 0.693Femme 0.185 0.464 0.483 0.382PrimaireSecondaire0.2<strong>37</strong>0.3860.2180.1480.2020.1520.2170.226Non scolarisé 0.<strong>37</strong>7 0.634 0.646 0.556Caractéristiques de l'établissementAncienneté (années) 5.7 7.4 6.4 6.5CA annuel Milliers FcfaVA milliers Fcfa8 954.53 927.34 977.92 026.46 146.91 425.76 735.82 394.2CA 50 Millions et plus 0.009 0.006 0.009 0.008CA 10 à 49 MC A 5 à 9 M0.2790.1830.1090.1730.1610.1410.1850.163CA 1 à 4 M 0.<strong>37</strong>7 0.466 0.450 0.431CA < 1 MPaiement impôts et taxes0.1520.8830.2460.7990.2390.8480.2130.846Nb employés 2.03 1.18 0.28 1.09Intensité Capitalistique Productivité horaire (1)184.30.33927.60.23335.00.23881.10.281Benef. net mensuel Milliers F 292.5 154.8 112.3 181.9Etab l. dt Benef < SMIG 0.293 0.408 0.465 0.394Etab l. dt Benef < 100 000 F(2) 0.452 0.682 0.704 0.617Caractéristiques des employésProportion femmes 0.28 0. 27 0.46 0.30Proportion salariés permProportion salariés occas0.210.130. 140.080.090.030.180.10Proportion apprentisProportion aides-Fam.0.360.290.350.430.140.750.330.38Rémun. mens. Milliers F 120.1 77.2 48.5 92.2(1) Méthode Quick Cluster de SPSS. Lorsque les variables sont dichotomiques, les moyennes représentent lespourcentages . (2) VA/Nombre d’Heures de Travail Normalisées et Pondérées (216H/mois en considérant que les salariéspermanents et patrons sont deux fois plus productifs). (3) Niveau de pauvreté moyen (hors Abidjan).84