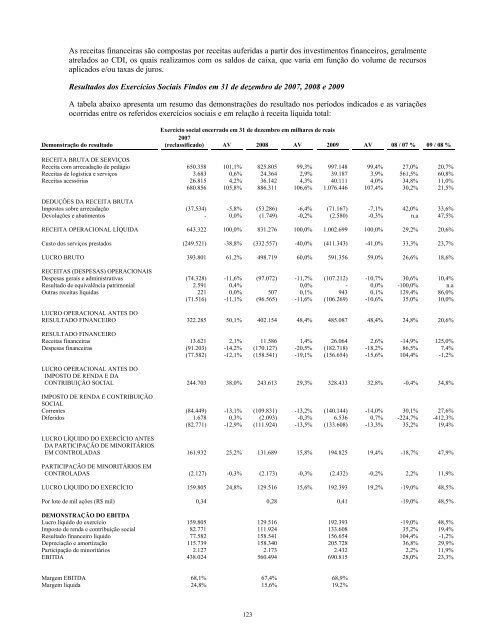
D<strong>em</strong>onstra<strong>do</strong>s pelos valores nominais conheci<strong>do</strong>s ou calculáveis, acresci<strong>do</strong>s, quan<strong>do</strong> aplicável, <strong>do</strong>scorrespondentes encargos, variações monetárias e/ou cambiais incorri<strong>do</strong>s até as datas <strong>do</strong>s balançospatrimoniais.DESCRIÇÃO DAS PRINCIPAIS CONTAS DA DEMONSTRAÇÃO DE RESULTADOReceita bruta de serviçosRepresentada quase <strong>em</strong> sua totalidade pela receita da cobrança de pedágio das nossas Concessionárias. Outrasfontes de receita são:• Receita de logística e serviços - representada pelos serviços presta<strong>do</strong>s na área de logística, que se refer<strong>em</strong> aoestacionamento de caminhões e operações de movimentação, armazenag<strong>em</strong> e reparos de containeres vazios,b<strong>em</strong> como às receitas de adesão e manutenção ao sist<strong>em</strong>a de pedágio eletrônico; e• Receitas acessórias das concessionárias - advindas de uso da faixa de <strong>do</strong>mínio, tarifas de cargasespeciais, concessão de acesso a estabelecimentos, publicidade e estadia de veículos <strong>em</strong> pátios deapreensão.Deduções da receita brutaOs impostos e contribuições incidentes sobre a receita operacional bruta são:• Imposto sobre Serviços – ISS, aplica<strong>do</strong> sobre a receita operacional bruta à alíquota variável,dependen<strong>do</strong> de cada município, até o limite de 5,0%;• Programa de Integração Social – PIS, praticada atualmente a alíquota de 0,65% (regime nãocumulativo) para os serviços públicos presta<strong>do</strong>s pelas Concessionárias, e de 1,65% (regimecumulativo) para nossas d<strong>em</strong>ais controladas, incidente sobre a receita operacional bruta; e• Contribuição para Financiamento da Seguridade Social – COFINS, cuja alíquota correspondeatualmente a 3,0% (regime não cumulativo) para os serviços públicos presta<strong>do</strong>s pelasConcessionárias, e de 7,6% (regime cumulativo) para nossas d<strong>em</strong>ais controladas, incidente sobre areceita operacional bruta.Custos <strong>do</strong>s serviços presta<strong>do</strong>sOs custos <strong>do</strong>s serviços presta<strong>do</strong>s consist<strong>em</strong> <strong>em</strong> despesas incorridas com manutenção, depreciação eamortização, despesa de concessão, salários e benefícios aos <strong>em</strong>prega<strong>do</strong>s da área operacional, seguros,eletricidade, combustíveis, telecomunicações e d<strong>em</strong>ais despesas. Tais custos são afeta<strong>do</strong>s por reajustes decontratos de acor<strong>do</strong> com índices neles estabeleci<strong>do</strong>s, por dissídio coletivo, por investimentos, devi<strong>do</strong> aoaumento da depreciação, e pelo aumento da receita (ônus variável).Despesas gerais e administrativasAs despesas gerais e administrativas correspond<strong>em</strong>, principalmente, a salários e benefícios concedi<strong>do</strong>s à administraçãoe aos <strong>em</strong>prega<strong>do</strong>s e a despesas com serviços de terceiros (segurança, consultorias administrativas, jurídicas efinanceiras). Fatores como inflação e número de funcionários pod<strong>em</strong> influenciar estas despesas.Resulta<strong>do</strong> financeiroA conta de resulta<strong>do</strong> financeiro líqui<strong>do</strong> é composta pelas despesas e receitas financeiras, b<strong>em</strong> como oreconhecimento da variação cambial sobre <strong>em</strong>préstimos toma<strong>do</strong>s <strong>em</strong> moeda estrangeira.As despesas financeiras consist<strong>em</strong>, basicamente, <strong>em</strong> juros incidentes sobre os endividamentos que estãocontrata<strong>do</strong>s sob regime de taxas flutuantes de juros. Os juros incidentes aumentam de acor<strong>do</strong> com ocrescimento <strong>do</strong> nível de endividamento e/ou taxas de juros.122
As receitas financeiras são compostas por receitas auferidas a partir <strong>do</strong>s investimentos financeiros, geralmenteatrela<strong>do</strong>s ao CDI, os quais realizamos com os sal<strong>do</strong>s de caixa, que varia <strong>em</strong> função <strong>do</strong> volume de recursosaplica<strong>do</strong>s e/ou taxas de juros.Resulta<strong>do</strong>s <strong>do</strong>s Exercícios Sociais Fin<strong>do</strong>s <strong>em</strong> 31 de dez<strong>em</strong>bro de 20<strong>07</strong>, 2008 e 2009A tabela abaixo apresenta um resumo das d<strong>em</strong>onstrações <strong>do</strong> resulta<strong>do</strong> nos perío<strong>do</strong>s indica<strong>do</strong>s e as variaçõesocorridas entre os referi<strong>do</strong>s exercícios sociais e <strong>em</strong> relação à receita líquida total:D<strong>em</strong>onstração <strong>do</strong> resulta<strong>do</strong>Exercício social encerra<strong>do</strong> <strong>em</strong> 31 de dez<strong>em</strong>bro <strong>em</strong> milhares de reais20<strong>07</strong>(reclassifica<strong>do</strong>) AV 2008 AV 2009 AV 08 / <strong>07</strong> % 09 / 08 %RECEITA BRUTA DE SERVIÇOSReceita com arrecadação de pedágio 650.358 101,1% 825.8<strong>05</strong> 99,3% 997.148 99,4% 27,0% 20,7%Receitas de logística e serviços 3.683 0,6% 24.364 2,9% 39.187 3,9% 561,5% 60,8%Receitas acessórias 26.815 4,2% 36.142 4,3% 40.111 4,0% 34,8% 11,0%680.856 1<strong>05</strong>,8% 886.311 106,6% 1.<strong>07</strong>6.446 1<strong>07</strong>,4% 30,2% 21,5%DEDUÇÕES DA RECEITA BRUTAImpostos sobre arrecadação (37.534) -5,8% (53.286) -6,4% (71.167) -7,1% 42,0% 33,6%Devoluções e abatimentos - 0,0% (1.749) -0,2% (2.580) -0,3% n.a 47,5%RECEITA OPERACIONAL LÍQUIDA 643.322 100,0% 831.276 100,0% 1.002.699 100,0% 29,2% 20,6%Custo <strong>do</strong>s serviços presta<strong>do</strong>s (249.521) -38,8% (332.557) -40,0% (411.343) -41,0% 33,3% 23,7%LUCRO BRUTO 393.801 61,2% 498.719 60,0% 591.356 59,0% 26,6% 18,6%RECEITAS (DESPESAS) OPERACIONAISDespesas gerais e administrativas (74.328) -11,6% (97.<strong>07</strong>2) -11,7% (1<strong>07</strong>.212) -10,7% 30,6% 10,4%Resulta<strong>do</strong> de equivalência patrimonial 2.591 0,4% 0,0% - 0,0% -100,0% n.aOutras receitas líquidas 221 0,0% 5<strong>07</strong> 0,1% 943 0,1% 129,4% 86,0%(71.516) -11,1% (96.565) -11,6% (106.269) -10,6% 35,0% 10,0%LUCRO OPERACIONAL ANTES DORESULTADO FINANCEIRO 322.285 50,1% 402.154 48,4% 485.087 48,4% 24,8% 20,6%RESULTADO FINANCEIROReceitas financeiras 13.621 2,1% 11.586 1,4% 26.064 2,6% -14,9% 125,0%Despesas financeiras (91.203) -14,2% (170.127) -20,5% (182.718) -18,2% 86,5% 7,4%(77.582) -12,1% (158.541) -19,1% (156.654) -15,6% 104,4% -1,2%LUCRO OPERACIONAL ANTES DOIMPOSTO DE RENDA E DACONTRIBUIÇÃO SOCIAL 244.703 38,0% 243.613 29,3% 328.433 32,8% -0,4% 34,8%IMPOSTO DE RENDA E CONTRIBUIÇÃOSOCIALCorrentes (84.449) -13,1% (109.831) -13,2% (140.144) -14,0% 30,1% 27,6%Diferi<strong>do</strong>s 1.678 0,3% (2.093) -0,3% 6.536 0,7% -224,7% -412,3%(82.771) -12,9% (111.924) -13,5% (133.608) -13,3% 35,2% 19,4%LUCRO LÍQUIDO DO EXERCÍCIO ANTESDA PARTICIPAÇÃO DE MINORITÁRIOSEM CONTROLADAS 161.932 25,2% 131.689 15,8% 194.825 19,4% -18,7% 47,9%PARTICIPAÇÃO DE MINORITÁRIOS EMCONTROLADAS (2.127) -0,3% (2.173) -0,3% (2.432) -0,2% 2,2% 11,9%LUCRO LÍQUIDO DO EXERCÍCIO 159.8<strong>05</strong> 24,8% 129.516 15,6% 192.393 19,2% -19,0% 48,5%Por lote de mil ações (R$ mil) 0,34 0,28 0,41 -19,0% 48,5%DEMONSTRAÇÃO DO EBITDALucro líqui<strong>do</strong> <strong>do</strong> exercício 159.8<strong>05</strong> 129.516 192.393 -19,0% 48,5%Imposto de renda e contribuição social 82.771 111.924 133.608 35,2% 19,4%Resulta<strong>do</strong> financeiro líqui<strong>do</strong> 77.582 158.541 156.654 104,4% -1,2%Depreciação e amortização 115.739 158.340 2<strong>05</strong>.728 36,8% 29,9%Participação de minoritários 2.127 2.173 2.432 2,2% 11,9%EBITDA 438.024 560.494 690.815 28,0% 23,3%Marg<strong>em</strong> EBITDA 68,1% 67,4% 68,9%Marg<strong>em</strong> líquida 24,8% 15,6% 19,2%123
- Page 1 and 2:
Prospecto Preliminar de Oferta Púb
- Page 3 and 4:
ÍNDICEParte I - INTRODUÇÃODEFINI
- Page 5 and 6:
DECLARAÇÃO DOS ACIONISTAS VENDEDO
- Page 7 and 8:
Resultado financeiro ..............
- Page 9 and 10:
Ecopátio Cubatão ................
- Page 11 and 12:
NOSSAS OPERAÇÕES ................
- Page 13 and 14:
Marcas ............................
- Page 15 and 16:
CONTRATOS COM O CONSÓRCIO SERRA DO
- Page 17 and 18:
Histórico de Pagamento de Dividend
- Page 19 and 20:
DEFINIÇÕESPara fins do presente P
- Page 21 and 22:
Banco Central ou BACENBIDBic BancoB
- Page 23 and 24:
Contrato de DistribuiçãoContrato
- Page 25 and 26:
E&YEBITDAEcopátio CubatãoEcopáti
- Page 27 and 28:
Investidores InstitucionaisInvestid
- Page 29 and 30:
Opção de AçõesAdicionaisOpção
- Page 31 and 32:
Procedimento deBookbuildingProcesso
- Page 33 and 34:
Termo de Anuência dosAcionistas Co
- Page 35 and 36:
perspectivas podem vir a não se co
- Page 37 and 38:
Essas alterações têm como objeti
- Page 39 and 40:
INFORMAÇÕES CADASTRAIS DA COMPANH
- Page 41 and 42:
46%. Até 30 de setembro de 2009, o
- Page 43 and 44:
O Credit Suisse está presente em m
- Page 45 and 46:
• Investment Management: assessor
- Page 47 and 48:
• Sistema Logístico Rio Grande d
- Page 49 and 50:
A Elog, nossa subsidiária integral
- Page 51 and 52:
significativas de nosso crescimento
- Page 53 and 54:
ORGANOGRAMA SOCIETÁRIOO organogram
- Page 55 and 56:
SUMÁRIO DAS INFORMAÇÕES FINANCEI
- Page 57 and 58:
Em 31 de dezembro em milhares de re
- Page 59 and 60:
Oferta PrimáriaOferta SecundáriaO
- Page 61 and 62:
Oferta de VarejoOferta aos Empregad
- Page 63 and 64:
Direito de Venda Conjunta(Tag along
- Page 65 and 66:
Estabilização do Preço dasAçõe
- Page 67 and 68:
Acionista (1)Número de Ações Ord
- Page 69 and 70:
Após a conclusão da Oferta, sem c
- Page 71 and 72: investimento. O investimento em Aç
- Page 73 and 74: entre todos os Empregados, proporci
- Page 75 and 76: terço à quantidade de Ações ini
- Page 77 and 78: RESTRIÇÕES À NEGOCIAÇÃO DE AÇ
- Page 79 and 80: (f) todos os demais direitos assegu
- Page 81 and 82: favor observar a seção “Discuss
- Page 83 and 84: Acionistas VendedoresNa data deste
- Page 85 and 86: Prospecto Preliminar e o Prospecto
- Page 87 and 88: COORDENADORESBanco BTG Pactual S.A.
- Page 89 and 90: EXEMPLARES DO PROSPECTO PRELIMINARO
- Page 91 and 92: Caso uma destas ações judiciais s
- Page 93 and 94: concessionárias Ecopistas, Ecovias
- Page 95 and 96: egidos pelas leis brasileiras, as q
- Page 97 and 98: de sanções penais, sem prejuízo
- Page 99 and 100: Enquanto estes acionistas continuar
- Page 101 and 102: • liquidez dos mercados financeir
- Page 103 and 104: obrigatória para o encerramento da
- Page 105 and 106: OPERAÇÕES VINCULADAS À OFERTANã
- Page 107 and 108: CAPITALIZAÇÃOA tabela a seguir de
- Page 109 and 110: As tabelas a seguir mostram alguns
- Page 111 and 112: Em 31 de dezembro em milhares de re
- Page 113 and 114: Exercício Social Encerrado em 31 d
- Page 115 and 116: DISCUSSÃO E ANÁLISE DA ADMINISTRA
- Page 117 and 118: correntes e da conta de capital e f
- Page 119 and 120: 11.638 e MP nº 449. Essa delibera
- Page 121: Na elaboração das demonstrações
- Page 125 and 126: Custo dos serviços prestadosO cust
- Page 127 and 128: 8.940 mil apurado em 2009 foi 41,3%
- Page 129 and 130: R$24.435 mil. Como percentual da re
- Page 131 and 132: Em 31 de dezembro em milhares de re
- Page 133 and 134: FornecedoresEm 31 de dezembro de 20
- Page 135 and 136: %sobre oTotal 2008% sobre oTotal200
- Page 137 and 138: variação é decorrente da opção
- Page 139 and 140: Credores Empresa Moeda(em milhares
- Page 141 and 142: das ações da Ecovias dos Imigrant
- Page 143 and 144: Saldo em Aberto emConcessionária C
- Page 145 and 146: INFORMAÇÕES RELATIVAS AO SETOR DE
- Page 147 and 148: INFORMAÇÕES RELATIVAS AO SETOR DE
- Page 149 and 150: CONCESSÕES FEDERAISA primeira conc
- Page 151 and 152: Lote Região Extensão (km)1 Divin
- Page 153 and 154: Lei Estadual nº 9.361, de 05 de ju
- Page 155 and 156: RECINTO ESPECIAL PARA DESPACHO ADUA
- Page 157 and 158: Ademais, o recente Decreto nº 6620
- Page 159 and 160: Tais responsabilidades da ETC esten
- Page 161 and 162: • Decreto Nº 1.102, de 21 de nov
- Page 163 and 164: Infra-Estrutura de Transportes - DN
- Page 165 and 166: Concessão Rodoviária do Sistema A
- Page 167 and 168: As Concessionárias têm o direito
- Page 169 and 170: Já no caso da Ecovia Caminho do Ma
- Page 171 and 172: tríplice fronteira entre Brasil, A
- Page 173 and 174:
de 67,7% em 2007 para 68,9% em 2009
- Page 175 and 176:
PRODUTOS E SERVIÇOS PRESTADOS E PA
- Page 177 and 178:
transporte relacionadas ao comérci
- Page 179 and 180:
Tarifa MédiaEm 31 de dezembro deTa
- Page 181 and 182:
Rodovia Trecho Extensão (km)PR 804
- Page 183 and 184:
088) e no km 111 (intersecção com
- Page 185 and 186:
ECOVIAS DOS IMIGRANTESBase Tarifár
- Page 187 and 188:
Histórico das Tarifas de PedágioN
- Page 189 and 190:
PEDÁGIOReceitas de PedágioAs rece
- Page 191 and 192:
Ações Educativas:• Campanhas de
- Page 193 and 194:
A tabela abaixo indica algumas cara
- Page 195 and 196:
RELAÇÃO DE DEPENDÊNCIA COM FORNE
- Page 197 and 198:
viabilidade ambiental do empreendim
- Page 199 and 200:
SEGUROSContratamos apólices de seg
- Page 201 and 202:
das rodovias, no investimento em mo
- Page 203 and 204:
RECURSOS HUMANOSEmpregadosEm 31 de
- Page 205 and 206:
Atualmente, existem 1.226 participa
- Page 207 and 208:
Processos Administrativos e Judicia
- Page 209 and 210:
que cumprimos o contrato de concess
- Page 211 and 212:
esponsáveis pela causa, não há e
- Page 213 and 214:
um terminal intermodal de cargas ro
- Page 215 and 216:
ADMINISTRAÇÃOCONSELHO DE ADMINIST
- Page 217:
Giuseppe Quarta. Italiano, nascido
- Page 220 and 221:
PROCESSOS JUDICIAIS E ADMINISTRATIV
- Page 222 and 223:
• Definir e consolidar os princí
- Page 224 and 225:
PRINCIPAIS ACIONISTAS E ACIONISTAS
- Page 226 and 227:
Primav Construções e Comércio S.
- Page 228 and 229:
Acordo de Acionistas STPEm 5 de dez
- Page 230 and 231:
como aos trilhos da MRS Logística
- Page 232 and 233:
Consórcio Planalto pela integral e
- Page 234 and 235:
Para informações detalhadas sobre
- Page 236 and 237:
Em 21 de janeiro de 2009, foi aprov
- Page 238 and 239:
voto e, em segunda convocação, co
- Page 240 and 241:
DIREITO DE RETIRADA E RESGATEDireit
- Page 242 and 243:
• Requerer a utilização de recu
- Page 244 and 245:
término de cada trimestre do exerc
- Page 246 and 247:
companhia ou sociedades ligadas; (i
- Page 248 and 249:
aceito pela CVM. É assegurada a re
- Page 250 and 251:
INFORMAÇÕES SOBRE TÍTULOS E VALO
- Page 252 and 253:
R$397.879.300,80, correspondente a
- Page 254 and 255:
DIVIDENDOS E POLÍTICA DE DIVIDENDO
- Page 256 and 257:
sido realizada para evitar o pagame
- Page 258 and 259:
ao montante do dividendo obrigatór
- Page 260 and 261:
• transparência na divulgação
- Page 262 and 263:
explicativa que demonstre a concili
- Page 264 and 265:
satisfazendo os requisitos da lei,
- Page 266 and 267:
Os acionistas da Companhia gozam de
- Page 268 and 269:
• estabelecimento de um relaciona
- Page 270 and 271:
A Plataforma pretende capacitar ao
- Page 272 and 273:
• acompanhar a implantação e o
- Page 274 and 275:
[página intencionalmente deixada e
- Page 276 and 277:
[página intencionalmente deixada e
- Page 278 and 279:
[página intencionalmente deixada e
- Page 280 and 281:
280
- Page 282 and 283:
282
- Page 284 and 285:
284
- Page 286 and 287:
286
- Page 288 and 289:
288
- Page 290 and 291:
290
- Page 292 and 293:
292
- Page 294 and 295:
294
- Page 296 and 297:
296
- Page 298 and 299:
298
- Page 300 and 301:
300
- Page 302 and 303:
[página intencionalmente deixada e
- Page 304 and 305:
[página intencionalmente deixada e
- Page 306 and 307:
306
- Page 308 and 309:
308
- Page 310 and 311:
[página intencionalmente deixada e
- Page 312 and 313:
ENCERRAMENTO: Nada mais havendo a t
- Page 314 and 315:
[página intencionalmente deixada e
- Page 316 and 317:
316
- Page 318 and 319:
[página intencionalmente deixada e
- Page 320 and 321:
320
- Page 322 and 323:
322
- Page 324 and 325:
[página intencionalmente deixada e
- Page 326 and 327:
326
- Page 328 and 329:
[página intencionalmente deixada e
- Page 330 and 331:
[página intencionalmente deixada e
- Page 332 and 333:
[página intencionalmente deixada e
- Page 334 and 335:
[página intencionalmente deixada e
- Page 336 and 337:
336
- Page 338 and 339:
338
- Page 340 and 341:
340
- Page 342 and 343:
342
- Page 344 and 345:
344
- Page 346 and 347:
346
- Page 348 and 349:
348
- Page 350 and 351:
350
- Page 352 and 353:
352
- Page 354 and 355:
354
- Page 356 and 357:
356
- Page 358 and 359:
358
- Page 360 and 361:
360
- Page 362 and 363:
362
- Page 364 and 365:
364
- Page 366 and 367:
366
- Page 368 and 369:
368
- Page 370 and 371:
370
- Page 372 and 373:
372
- Page 374 and 375:
[página intencionalmente deixada e
- Page 376 and 377:
376
- Page 378 and 379:
PRIMAV ECORODOVIAS S.A. E CONTROLAD
- Page 380 and 381:
Primav EcoRodovias S.A. e Controlad
- Page 382 and 383:
Primav EcoRodovias S.A. e Controlad
- Page 384 and 385:
Primav EcoRodovias S.A. e Controlad
- Page 386 and 387:
Primav EcoRodovias S.A. e Controlad
- Page 388 and 389:
PRIMAV ECORODOVIAS S.A. E CONTROLAD
- Page 390 and 391:
PRIMAV ECORODOVIAS S.A. E CONTROLAD
- Page 392 and 393:
PRIMAV ECORODOVIAS S.A. E CONTROLAD
- Page 394 and 395:
Primav EcoRodovias S.A. e Controlad
- Page 396 and 397:
Primav EcoRodovias S.A. e Controlad
- Page 398 and 399:
Primav EcoRodovias S.A. e Controlad
- Page 400 and 401:
Primav EcoRodovias S.A. e Controlad
- Page 402 and 403:
Primav EcoRodovias S.A. e Controlad
- Page 404 and 405:
Primav EcoRodovias S.A. e Controlad
- Page 406 and 407:
Primav EcoRodovias S.A. e Controlad
- Page 408 and 409:
Primav EcoRodovias S.A. e Controlad
- Page 410 and 411:
Primav EcoRodovias S.A. e Controlad
- Page 412 and 413:
Primav EcoRodovias S.A. e Controlad
- Page 414 and 415:
Primav EcoRodovias S.A. e Controlad
- Page 416 and 417:
Primav EcoRodovias S.A. e Controlad
- Page 418 and 419:
Primav EcoRodovias S.A. e Controlad
- Page 420 and 421:
Primav EcoRodovias S.A. e Controlad
- Page 422 and 423:
Primav EcoRodovias S.A. e Controlad
- Page 424 and 425:
[página intencionalmente deixada e
- Page 426 and 427:
426
- Page 428 and 429:
ECORODOVIAS INFRAESTRUTURA E LOGÍS
- Page 430 and 431:
ECORODOVIAS INFRAESTRUTURA E LOGÍS
- Page 432 and 433:
ECORODOVIAS INFRAESTRUTURA E LOGÍS
- Page 434 and 435:
EcoRodovias Infraestrutura e Logís
- Page 436 and 437:
EcoRodovias Infraestrutura e Logís
- Page 438 and 439:
EcoRodovias Infraestrutura e Logís
- Page 440 and 441:
EcoRodovias Infraestrutura e Logís
- Page 442 and 443:
EcoRodovias Infraestrutura e Logís
- Page 444 and 445:
EcoRodovias Infraestrutura e Logís
- Page 446 and 447:
EcoRodovias Infraestrutura e Logís
- Page 448 and 449:
EcoRodovias Infraestrutura e Logís
- Page 450 and 451:
EcoRodovias Infraestrutura e Logís
- Page 452 and 453:
EcoRodovias Infraestrutura e Logís
- Page 454 and 455:
EcoRodovias Infraestrutura e Logís
- Page 456 and 457:
EcoRodovias Infraestrutura e Logís
- Page 458 and 459:
EcoRodovias Infraestrutura e Logís
- Page 460 and 461:
EcoRodovias Infraestrutura e Logís
- Page 462 and 463:
EcoRodovias Infraestrutura e Logís
- Page 464 and 465:
EcoRodovias Infraestrutura e Logís
- Page 466 and 467:
EcoRodovias Infraestrutura e Logís
- Page 468 and 469:
EcoRodovias Infraestrutura e Logís
- Page 470 and 471:
EcoRodovias Infraestrutura e Logís
- Page 472 and 473:
EcoRodovias Infraestrutura e Logís
- Page 474:
EcoRodovias Infraestrutura e Logís