

Child Pornography - Home | National Rapporteur on Trafficking in ...
Child Pornography - Home | National Rapporteur on Trafficking in ...
Child Pornography - Home | National Rapporteur on Trafficking in ...

Create successful ePaper yourself
Turn your PDF publications into a flip-book with our unique Google optimized e-Paper software.
206<br />
<str<strong>on</strong>g>Child</str<strong>on</strong>g> PornograPhy First report oF the Dutch NatioNal rapporteur<br />
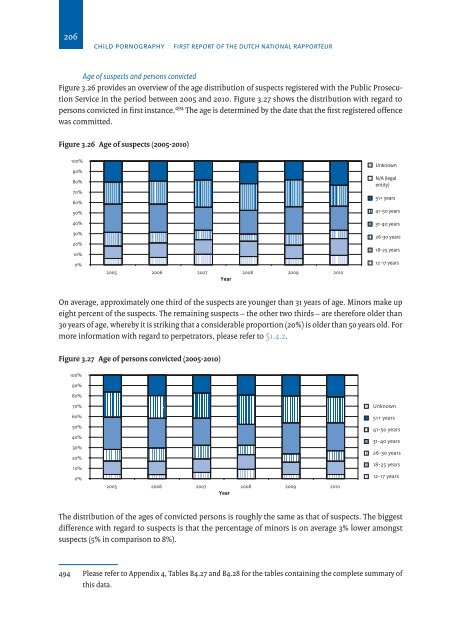
Age of suspects and pers<strong>on</strong>s c<strong>on</strong>victed<br />
Figure 3.26 provides an overview of the age distributi<strong>on</strong> of suspects registered with the Public Prosecuti<strong>on</strong><br />
Service <strong>in</strong> the period between 2005 and 2010. Figure 3.27 shows the distributi<strong>on</strong> with regard to<br />
pers<strong>on</strong>s c<strong>on</strong>victed <strong>in</strong> first <strong>in</strong>stance. 494 The age is determ<strong>in</strong>ed by the date that the first registered offence<br />
was committed.<br />
Figure 3.26 Age of suspects (2005-2010)<br />
100%<br />
90%<br />
80%<br />
70%<br />
60%<br />
50%<br />
40%<br />
30%<br />
20%<br />
10%<br />
0%<br />
2005 2006 2007 2008 2009 2010<br />
Year<br />
Unknown<br />
N/A (legal<br />
entity)<br />
51+ years<br />
41-50 years<br />
31-40 years<br />
26-30 years<br />
18-25 years<br />
12-17 years<br />
On average, approximately <strong>on</strong>e third of the suspects are younger than 31 years of age. M<strong>in</strong>ors make up<br />
eight percent of the suspects. The rema<strong>in</strong><strong>in</strong>g suspects – the other two thirds – are therefore older than<br />
30 years of age, whereby it is strik<strong>in</strong>g that a c<strong>on</strong>siderable proporti<strong>on</strong> (20%) is older than 50 years old. For<br />
more <strong>in</strong>formati<strong>on</strong> with regard to perpetrators, please refer to §1.4.2.<br />
Figure 3.27 Age of pers<strong>on</strong>s c<strong>on</strong>victed (2005-2010)<br />
100%<br />
90%<br />
80%<br />
70%<br />
60%<br />
50%<br />
40%<br />
30%<br />
20%<br />
10%<br />
0%<br />
2005 2006 2007 2008 2009 2010<br />
Year<br />
Unknown<br />
51+ years<br />
41-50 years<br />
31-40 years<br />
26-30 years<br />
18-25 years<br />
12-17 years<br />
The distributi<strong>on</strong> of the ages of c<strong>on</strong>victed pers<strong>on</strong>s is roughly the same as that of suspects. The biggest<br />
difference with regard to suspects is that the percentage of m<strong>in</strong>ors is <strong>on</strong> average 3% lower am<strong>on</strong>gst<br />
suspects (5% <strong>in</strong> comparis<strong>on</strong> to 8%).<br />
494 Please refer to Appendix 4, Tables B4.27 and B4.28 for the tables c<strong>on</strong>ta<strong>in</strong><strong>in</strong>g the complete summary of<br />
this data.