- Page 1 and 2:
, ECONOMICS OF ON-FARM DEVELOPMENT:
- Page 3 and 4:
DEC LARA TION I declare that the th
- Page 5 and 6:
I thank Dr. KM Varadan, CWRDM. Kozh
- Page 7 and 8:
CONTENTS Chapter 1 1.1 1.2 1.3 1.4
- Page 9 and 10:
4.9 Occupational Status of<
- Page 11 and 12:
5.3 5.4 5.6 5.7 Financial Investmen
- Page 13 and 14:
Figures 6.1 6.2 Chart 6.1 Appendix
- Page 15 and 16:
Abbreviations used ASMO BFA's CADA
- Page 17 and 18:
An attempt has been made in this ch
- Page 19 and 20:
among the people and the process <s
- Page 21 and 22:
the Indian state had followed a pol
- Page 23 and 24:
water harvesting 7 by arguing that
- Page 25 and 26:
(World Register of
- Page 27 and 28:
Eighth Plan has been estimated by t
- Page 29 and 30:
One of the most im
- Page 31 and 32:
integrated development of</
- Page 33 and 34:
inadequate attention given to OFD w
- Page 35 and 36:
performance of irr
- Page 37 and 38:
created. According to the Central W
- Page 39 and 40:
7 lagoons, 901 tanks and over 30 la
- Page 41 and 42:
competent and responsible agency wi
- Page 43 and 44:
physiographic conditions of
- Page 45 and 46:
(14 completed and 15 ongoing) proje
- Page 47 and 48:
interventions to improve the operat
- Page 49 and 50:
a summary of findi
- Page 51 and 52:
economic analysis of</stron
- Page 53 and 54:
een brought out by many scholars in
- Page 55 and 56:
While the economic benefits <strong
- Page 57 and 58:
sources, wasteful utilisation <stro
- Page 59 and 60:
such as rise in pnces, inadequate i
- Page 61 and 62:
the completion of
- Page 63 and 64:
of rainfed croppin
- Page 65 and 66:
areas being 8 per cent (GO!, 1998).
- Page 67 and 68:
investment In irrigation developmen
- Page 69 and 70:
Subsequently, an Expert Committee w
- Page 71 and 72:
highlighted the problems related to
- Page 73 and 74:
2.3.1 Studies on tbe impact <strong
- Page 75 and 76:
command area has reduced the labour
- Page 77 and 78:
Nanjundappa (1988), while examining
- Page 79 and 80:
y the CADA have led to low producti
- Page 81 and 82:
agents as against 90 per cent or mo
- Page 83 and 84:
among their members; c) insisting t
- Page 85 and 86:
Ansari (1989) shows that there have
- Page 87 and 88:
unit of land culti
- Page 89 and 90:
subgroup increased from 40 per cent
- Page 91 and 92:
1) The maIn activity being undertak
- Page 93 and 94:
which are unique in several ways, t
- Page 95 and 96:
across the states in different agro
- Page 97 and 98:
and social setting In which a proje
- Page 99 and 100:
The indepth study to examine the fa
- Page 101 and 102:
\,;nar~ .NO. ~.~: .t"rocesses ana s
- Page 103 and 104:
understand the problems related to
- Page 105 and 106:
of the crop produc
- Page 107 and 108:
greater differences between the the
- Page 109 and 110:
Chart ~o J.2 'Vater Institutions an
- Page 111 and 112:
specific promotional programmes und
- Page 113 and 114:
Chart No. 3.3 Explaining failure <s
- Page 115 and 116:
3.3.2 Crop specific promotional ins
- Page 117 and 118:
non-viable paddy. Even the farmers
- Page 119 and 120:
'- K01HIKOO --', , .-- :,' , \. ,.'
- Page 121 and 122:
strictly adhered to the directions
- Page 123 and 124:
4.1.2 Financial aspects The total e
- Page 125 and 126:
4.2 The Kallada Irrigation and Tree
- Page 127 and 128:
Map 4.4: Kallada Ayacut , IItIJrt ~
- Page 129 and 130:
in lands having slopes less than 3
- Page 131 and 132:
Table 4.1. Envisa~ed Croppin~ Patte
- Page 133 and 134:
in terms of underg
- Page 135 and 136:
meters. The end of
- Page 137 and 138:
and Kayamkulam branch in Phase II.
- Page 139 and 140:
lands. The average holding size is
- Page 141 and 142:
The characteristics of</str
- Page 143 and 144:
size group is the highest in the mi
- Page 145 and 146:
Table 4.10: Occupational status <st
- Page 147 and 148:
Appendix 4.1: Physical and technica
- Page 149 and 150:
Chapter 5 Dynamics of</stro
- Page 151 and 152:
plan. annual plans (1966-69) and th
- Page 153 and 154:
gt:ographical concentration <strong
- Page 155 and 156:
Concerted efforts were also made fo
- Page 157 and 158:
T a bl e 5 3 Ph . I d Ii . I - - vS
- Page 159 and 160:
expenditure and p~ysical achievemen
- Page 161 and 162:
the state cannot be treated as a pu
- Page 163 and 164:
in gross irrigated area. While cana
- Page 165 and 166:
development of lan
- Page 167 and 168:
The annual compound growth rates in
- Page 169 and 170:
5.2.1 Dynamics of
- Page 171 and 172:
area and yield of
- Page 173 and 174:
A micro level study by Narayanan (1
- Page 175 and 176:
ubber cultivation. in Kallada. the
- Page 177 and 178:
The debate on conversion of
- Page 179 and 180:
(Table 5.10). The table indicates t
- Page 181 and 182:
eqUires substantial investment for
- Page 183 and 184:
Source: Govt. of K
- Page 185 and 186:
the period 1985-86 to 1997-98. For
- Page 187 and 188:
The overall scenario suggests that
- Page 189 and 190:
project, they tend to undertake yie
- Page 191 and 192:
the establishment expenditure (stri
- Page 193 and 194:
a CriSIS. As the works involved In
- Page 195 and 196:
(ii) In the Karapuzha project. the
- Page 197 and 198:
5.15). The table indicates that the
- Page 199 and 200:
place. There were three revisions J
- Page 201 and 202:
Revenue vis Capital expenditure The
- Page 203 and 204:
Let us now examIne the intensity <s
- Page 205 and 206:
Cost escalation due to arbitration
- Page 207 and 208:
Another source of
- Page 209 and 210:
process would be very high. This al
- Page 211 and 212:
construction for more than 20 years
- Page 213 and 214:
are mainly concentrated in Thrissur
- Page 215 and 216:
ApMndlJ ~.1: ProjKI-wlw Ihne tn Tot
- Page 217 and 218:
ArlPcndil: ~.J: "'inanchtllnnstmrnl
- Page 219 and 220:
Chapter 6 Economics of</str
- Page 221 and 222:
conditions of the
- Page 223 and 224:
Chart: 6.1 Organisational Chart sho
- Page 225 and 226:
and Palakkad together occupy 10 <st
- Page 227 and 228:
Table 6.2. Physical and financial t
- Page 229 and 230:
the total allocation has been for t
- Page 231 and 232:
per cent achievement in physical te
- Page 233 and 234:
Besides. it has been reported that
- Page 235 and 236:
I , MalamDuzha 387 7.39 1908.53 13.
- Page 237 and 238:
~~- ~- --~ In all others. the BC ra
- Page 239 and 240:
possible in these lands during Khar
- Page 241 and 242:
Hence. it may be argued that since
- Page 243 and 244:
It is mainly due to scarcity <stron
- Page 245 and 246:
project. where it is very high at R
- Page 247 and 248:
proper coordination between variOUS
- Page 249 and 250:
deficiencies that help drawing less
- Page 251 and 252:
conjunctive use of
- Page 253 and 254:
3) Again. due to the high density <
- Page 255 and 256:
Table 6.13: Details of</str
- Page 257 and 258:
doubts about the senousness <strong
- Page 259 and 260:
practice IS more conspIcuous In the
- Page 261 and 262:
2.05 HP as compared to 1.68 HP in t
- Page 263 and 264:
large holders have spent two to thr
- Page 265 and 266:
Farming is considered mostly as a s
- Page 267 and 268: The profitability
- Page 269 and 270: noticed in the case of</str
- Page 271 and 272: The Cobb-Douglas (CD) Function has
- Page 273 and 274: · 13 Bank assistance programme and
- Page 275 and 276: etween I to 2 ha. are to arrange fo
- Page 277 and 278: Table 6.22: Status of</stro
- Page 279 and 280: Though almost all the farmers repor
- Page 281 and 282: 3854 in the middle reaches. The pro
- Page 283 and 284: The net income from vegetables and
- Page 285 and 286: Appendix 6.1: Project-Wise Physical
- Page 287 and 288: Chapter 7 On-Farm Development: Dete
- Page 289 and 290: It can be seen from the survey data
- Page 291 and 292: een made to examme as to how many f
- Page 293 and 294: a farmer to use water from the dist
- Page 295 and 296: The farmers were asked to reflect u
- Page 297 and 298: evamping needed to reorient the MCS
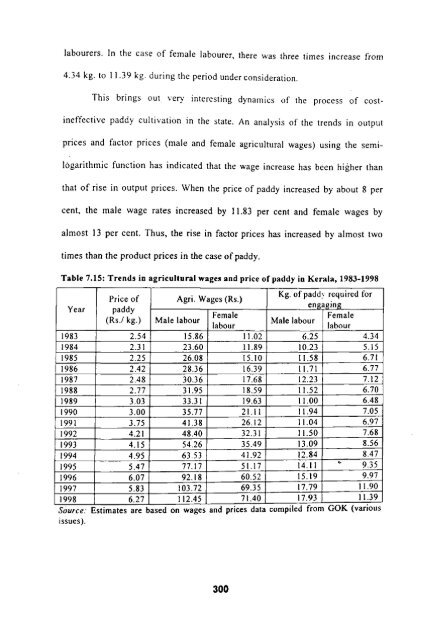
- Page 299 and 300: supplies. What is more interesting
- Page 301 and 302: the knowledge of i
- Page 303 and 304: All of the five ex
- Page 305 and 306: It is evident from the table that t
- Page 307 and 308: implications on the dynamics <stron
- Page 309 and 310: competitive monocropl2 as no other
- Page 311 and 312: of conversion thro
- Page 313 and 314: involving farmers as active members
- Page 315 and 316: The viability of p
- Page 317: factors l8 . As a result. the agric
- Page 321 and 322: may be observed that the canal seep
- Page 323 and 324: process of paddy l
- Page 325 and 326: Table 7.19: Productivity and gross
- Page 327 and 328: The technical constraints In the de
- Page 329 and 330: 2) Lack of irrigat
- Page 331 and 332: manure or fertilisers are also do n
- Page 333 and 334: according to the conventional basin
- Page 335 and 336: Registration Act, 1860 in the erstw
- Page 337 and 338: The pattern of act
- Page 339 and 340: eported by CADA of
- Page 341 and 342: Appendix 7.2: Paddy land conversion
- Page 343 and 344: d,l!llS in the post-independence pc
- Page 345 and 346: all(lcatioll ill the absence <stron
- Page 347 and 348: irrigation commands. Th;; stud) was
- Page 349 and 350: comparative COSI .:conomlcs <strong
- Page 351 and 352: time lag involved in completion uf
- Page 353 and 354: the state has increased by about 46
- Page 355 and 356: cultivation of com
- Page 357 and 358: through the effective implementatiC
- Page 359 and 360: een the highest in Kallada project
- Page 361 and 362: It was noticed that among the vario
- Page 363 and 364: The institutional paradigm evolved
- Page 365 and 366: of India to be rel
- Page 367 and 368: economically viable. This underscor
- Page 369 and 370:
The intensity and spread of
- Page 371 and 372:
of allocation and
- Page 373 and 374:
shows that filed realities have not
- Page 375 and 376:
as water management related factors
- Page 377 and 378:
labour intensive farming operations
- Page 379 and 380:
Given the dynamics, problems and co
- Page 381 and 382:
ground realities associated with cr
- Page 383 and 384:
Dhawan, B.D. (1989): Sludies in Irr
- Page 385 and 386:
Kothari, Rajni, (1989): Politics an
- Page 387 and 388:
Vaidyanathan, A (1999): Water Resou
- Page 389 and 390:
Ghosh, Prabir De, Budhadeb (1998):
- Page 391 and 392:
Nair, Sukumaran, M.K. (1999): 'Rura
- Page 393 and 394:
Varadan, K,~ (1999): 'Estimation <s
- Page 395 and 396:
GOK (1967b): Evaluation of<
- Page 397 and 398:
Ferrer. A.M., .L.e. Lucero (1988):
- Page 399 and 400:
Suresh, K.A. (2000): 'Group Managem
- Page 401 and 402:
Tomlinson, B.R. (1992): 'The Indian