- Page 1:
AMOS MUMBA TARJA KETOLA (Eds) Respo
- Page 5 and 6:
Publisher Date of publication Vaasa
- Page 7 and 8:
CONTENTS Abstract in Finnish.......
- Page 9 and 10:
PART FIVE: CR MEASURES & STANDARDS
- Page 11 and 12:
PART ELEVEN: RESPONSIBLE LEADERSHIP
- Page 13 and 14:
PART ONE. COPORATE SUSTAINABILITY M
- Page 15 and 16:
Mr. Martin Clarke joined British Pr
- Page 17 and 18:
performances, e.g. cement productio
- Page 19 and 20:
“…identifying, managing and min
- Page 21 and 22:
The above list places emphasis acro
- Page 23 and 24:
Discussion: What Could Product Stew
- Page 25 and 26:
performance being awarded. Currentl
- Page 27 and 28:
CPA. 2007. Delivering sustainabilit
- Page 29 and 30:
Lewis. H. 2004. Defining product st
- Page 31 and 32:
ICRISAT - FROM A SUSTAINABLE POINT
- Page 33 and 34:
sorghum, pearl millet, chickpea, pi
- Page 35 and 36:
This action plan seems to produce g
- Page 37 and 38:
effects on nutrition and trace elem
- Page 39 and 40:
In figure two we can see the expend
- Page 41 and 42:
goods, but rather on insubstantial
- Page 43 and 44:
pressed to compete with an industri
- Page 45 and 46:
References CGIAR (2008). The Origin
- Page 47 and 48:
What is a Global Business Organizat
- Page 49 and 50:
The majority of the above seven cri
- Page 51 and 52:
38 3 Limited statement NAM 75 NAM /
- Page 53 and 54:
40 Statement 4 Limited Statement NA
- Page 55 and 56:
equirements, but at the same time b
- Page 57 and 58:
transition from EMS to SMS can be a
- Page 59 and 60:
adequate as an SMS in a GBO. Furthe
- Page 61 and 62:
48 Table 2: Detailed Description of
- Page 63 and 64:
50 substitution is recognized, but
- Page 65 and 66:
52 acted on Improvement Process Usi
- Page 67 and 68:
54 Boundary & interface between SMS
- Page 69 and 70:
56 System Component #6 - Value Chai
- Page 71 and 72:
58 requirements implemented actions
- Page 73 and 74:
Global Reporting Initiative (2006).
- Page 75 and 76:
van Tulder, R., van den Berghe, D.,
- Page 77 and 78:
esponsibilities to stakeholders and
- Page 79 and 80:
develop improvement and learning sy
- Page 81 and 82:
easonably well now and making them
- Page 83 and 84:
Responsible competitiveness The que
- Page 85 and 86:
examples? What are the main commitm
- Page 87 and 88:
Responsibility to users of products
- Page 89 and 90:
of independent research institutes
- Page 91 and 92:
development that capture and estima
- Page 93 and 94:
Hooghe L, Marks G. (2003). Unraveli
- Page 95 and 96:
Waddock, S. and Bodwell C. (2007).
- Page 97 and 98:
THE INTEGRATION OF CSR INTO BUSINES
- Page 99 and 100:
Theoretical Background Strategic CS
- Page 101 and 102:
against specific requirements. The
- Page 103 and 104:
industries (energy, utilities, oil
- Page 105 and 106:
Different Approaches to CSR The two
- Page 107 and 108:
• Electromagnetism and impact on
- Page 109 and 110:
Conclusions In the first stage of t
- Page 111 and 112:
Appendix A Level of integration of
- Page 113 and 114:
99 High Independent BU/Committee de
- Page 115 and 116:
101 McAdam, R. & Leonard, D. (2003)
- Page 117 and 118:
ECONOMIC DOWNTURN AND THE LANGUAGE
- Page 119 and 120:
105 Additionally, for Foucault, and
- Page 121 and 122:
Approach 107 The discussion in this
- Page 123 and 124:
need for firms to tighten their bel
- Page 125 and 126:
esult of economic-market system; th
- Page 127 and 128:
Resource Allocation and the Home of
- Page 129 and 130:
115 Such divergent views raise ques
- Page 131 and 132:
References Accountancy Age (2009) C
- Page 133 and 134:
IMAGE DIFFERENCIATION WITH CORPORAT
- Page 135 and 136:
121 argues that industries with a c
- Page 137 and 138:
123 Since not all stakeholders valu
- Page 139 and 140:
Empirical Findings The first propos
- Page 141 and 142:
127 The right amount of CR is when
- Page 143 and 144:
Environmentally Responsible Image D
- Page 145 and 146:
corporate responsibility can be a m
- Page 147 and 148:
References Ansoff, H. I. & McDonnel
- Page 149 and 150:
Miller, D. (1992). The Generic Stra
- Page 151 and 152:
SEED INDUSTRY RESPONSIBILITY TO AGR
- Page 153 and 154:
139 intellectual property protectio
- Page 155 and 156:
141 Thus, they stress their donatio
- Page 157 and 158:
Social Issues 143 Regarding the soc
- Page 159 and 160:
145 food system which in their opin
- Page 161 and 162:
DuPont (2002). Science, Solutions a
- Page 163 and 164:
IgNN (2008c). Brüssel will bessere
- Page 165 and 166:
A VALUE CHAIN ANALYSIS OF THE ORGAN
- Page 167 and 168:
153 friendly ranges setting a trend
- Page 169 and 170:
The Main Factors Affecting The Grow
- Page 171 and 172:
157 Governments, particularly in Eu
- Page 173 and 174:
Table 4: Value addition at each sta
- Page 175 and 176:
organic cotton farms typically achi
- Page 177 and 178:
163 Cumulative value loss/ addition
- Page 179 and 180:
165
- Page 181 and 182:
167 own standards to certify variou
- Page 183 and 184:
Price difference in organic and con
- Page 185 and 186:
References 171 Alfoeldi, T., Fließ
- Page 187 and 188:
173 Fliessbach, A. and Mäder, P. (
- Page 189 and 190:
175 Sinden, J. A., Griffith, G. (20
- Page 191 and 192:
INSTITUTIONALISING IDEALISM: PATTER
- Page 193 and 194:
179 Social considerations include i
- Page 195 and 196:
Coercive Adoption 181 The second st
- Page 197 and 198:
of non-adopters; the moral content
- Page 199 and 200:
References Ackerman, R. (1973). How
- Page 201 and 202:
Economist. (2008). The next questio
- Page 203 and 204:
Porter, M., & Kramer, M. (2002). Th
- Page 205 and 206:
CULTURAL CONTEXT OF CSR: COMPARATIV
- Page 207 and 208:
193 power is distributed unequally.
- Page 209 and 210:
195 Figure 1: Values Associated wit
- Page 211 and 212:
197 answering the questions. Most D
- Page 213 and 214:
Culture in Nation-Institutions 199
- Page 215 and 216:
201 In line with the collectivistic
- Page 217 and 218:
Stakeholders 203 From the field-lev
- Page 219 and 220:
Codes & Policies Volunteering Phila
- Page 221 and 222:
207 The wealth capacity-building in
- Page 223 and 224:
Hannigan, J. A. (2006). Social cons
- Page 225 and 226:
211 Thelen, K. & Steinmo, S. (1992)
- Page 227 and 228:
213 Historically, Danish companies
- Page 229 and 230:
215 survey was carried out by email
- Page 231 and 232:
217 role, especially in the 1990s,
- Page 233 and 234:
when CSR policies in Denmark were m
- Page 235 and 236:
221 The business areas of the Danfo
- Page 237 and 238:
223 While looking at the CSR Waves,
- Page 239 and 240:
225 marital affairs and on financia
- Page 241 and 242:
whether Danfoss is considered good
- Page 243 and 244:
229 the making of Danfoss’ Ethics
- Page 245 and 246:
have, from participating in interna
- Page 247 and 248:
Global Reporting Initiative. G3 Gui
- Page 249 and 250:
Negative List for Substances and Ma
- Page 251 and 252:
237 and three. In both approaches k
- Page 253 and 254:
239 protection/environmental enhanc
- Page 255 and 256:
241 sufficiently informed only by b
- Page 257 and 258:
Table 3: Traditional versus sophist
- Page 259 and 260:
• Dialogue needs to go beyond dis
- Page 261 and 262:
and needs of CSR-for-SD as outlined
- Page 263 and 264:
• evaluations are externally faci
- Page 265 and 266:
251 • Values and cultural factors
- Page 267 and 268:
References 253 ACCA The Association
- Page 269 and 270:
Freeman, R.E. 1984. Strategic Manag
- Page 271 and 272:
257 Pretty, J., Shah, P. 1994. Soil
- Page 273 and 274:
PART THREE: CORPORATE RESPONSIBILIT
- Page 275 and 276:
261 business houses should follow t
- Page 277 and 278:
263 One other problem faced in Indi
- Page 279 and 280:
CORPORATE SOCIAL RESPONSIBILITY INI
- Page 281 and 282:
267 In spite of the increasing impo
- Page 283 and 284:
269 value, while either protecting
- Page 285 and 286:
identify the main trends of the CSR
- Page 287 and 288:
OIL AND GAS COMPANIES Table 1. CSR
- Page 289 and 290:
ENI EXXON PETROBRAS Evaluation of l
- Page 291 and 292:
TOTAL Promotion of several initiati
- Page 293 and 294:
e. Lack of Human Resources 279 The
- Page 295 and 296:
References Bevacqua, S. & Cascinai,
- Page 297 and 298:
PART FOUR: CORPORATE RESPONSIBILITY
- Page 299 and 300:
285 During the past decades, litera
- Page 301 and 302:
287 research involved three Tuscan
- Page 303 and 304:
289 • in terms of preferences on
- Page 305 and 306:
291 followed by lack of resources a
- Page 307 and 308:
293 health and safety of the worker
- Page 309 and 310:
References Adler, P. and S.-W. Kwon
- Page 311 and 312:
297 Russo A. and Tencati A. 2009, F
- Page 313 and 314:
299 by companies in order to contri
- Page 315 and 316:
301 economic growth it does not con
- Page 317 and 318:
Anttonen (2008) has divided chemica
- Page 319 and 320:
305 different types of consultative
- Page 321 and 322:
Picture 2. The BASF business model
- Page 323 and 324:
309 compounds are used in all indus
- Page 325 and 326:
311 Halme, M., Anttonen, M., Kuisma
- Page 327 and 328:
DOES OPEN INNOVATION STREGHTHEN COR
- Page 329 and 330:
Sustainable Change and CR 315 Due t
- Page 331 and 332:
317 OIM are all methods that open t
- Page 333 and 334:
319 expressive than an instrumental
- Page 335 and 336:
Results 321 It is new to accept and
- Page 337 and 338:
on process User mainly need- and kn
- Page 339 and 340:
325 interaction enables companies t
- Page 341 and 342:
References Alvesson, M. (2005). Und
- Page 343 and 344:
329 Hübscher, M. & Müller, M. (20
- Page 345 and 346:
Walcher, D. (2007). Der Ideenwettbe
- Page 347 and 348:
333 The current context in which or
- Page 349 and 350:
335 existence and are able to survi
- Page 351 and 352:
337 particular the political and le
- Page 353 and 354:
339 local variants emerged in Scand
- Page 355 and 356:
341 However, these output oriented
- Page 357 and 358:
Regarding the activity S2 ‘Stakeh
- Page 359 and 360:
References Achterbergh, J., Vriens,
- Page 361 and 362:
Nieuwkamp, B.E.M. (2008). De arbeid
- Page 363 and 364:
FINANCIAL VALUE MEASUREMENT OF CORP
- Page 365 and 366:
351 responsibility issues (roadmap)
- Page 367 and 368:
353 financial valuation measures. T
- Page 369 and 370:
Table 1. Features in the various ph
- Page 371 and 372:
sustainability data gathering and i
- Page 373 and 374:
Table 3. Sustainability-related GRI
- Page 375 and 376:
Three Illustrations of Deriving and
- Page 377 and 378:
363 where it uses renewable resourc
- Page 379 and 380:
References Adams, C. A. (2004). The
- Page 381 and 382:
367 Niskala, M., & Schadewitz, H. (
- Page 383 and 384:
Huhtamäki (Materials) Kemira (Mate
- Page 385 and 386:
OKO (Finance) organization with who
- Page 387 and 388:
373 [1] Global Reporting Initiative
- Page 389 and 390:
Introduction 375 The concepts relat
- Page 391 and 392:
Model Foundations First foundation
- Page 393 and 394:
As we can see in the Figure 2, on t
- Page 395 and 396:
381 model in subject. Through these
- Page 397 and 398:
383 For Schwartz and Bilsky (SCHWAR
- Page 399 and 400:
385 • Reaction: The organization
- Page 401 and 402:
Figure 7: Tripod of the sustainabil
- Page 403 and 404:
389 The second fundament of the mod
- Page 405 and 406:
Figure 10: Organizational Social Pe
- Page 407 and 408:
Figure 13: Wilber’s Model Source:
- Page 409 and 410:
Figure 15: Model of sustainable exc
- Page 411 and 412:
Figure 17: Proposal of model evalua
- Page 413 and 414:
399 Figure 19: Relationships took i
- Page 415 and 416:
Jung, C. F. (2003). Metodologia Cie
- Page 417 and 418:
Werre, Marco. & Marcel. Van Marrewi
- Page 419 and 420:
THE CASE OF SOCIAL ENTERPRISES: ARE
- Page 421 and 422:
407 The present paper aims to revie
- Page 423 and 424:
Belgium Law of 13 April 1995 United
- Page 425 and 426:
Social Enteprise: Some Definitions
- Page 427 and 428:
The Social Entrepreneurship Accordi
- Page 429 and 430:
Figure 1 The blurring sectoral boun
- Page 431 and 432:
f) An initiative launched by a grou
- Page 433 and 434:
References Alter, S.K. (2004) Socia
- Page 435 and 436:
A DISCOURSE ANALYSIS OF THE FAIRTRA
- Page 437 and 438:
423 constituting the social (Faircl
- Page 439 and 440:
425 Once economic behaviour is no l
- Page 441 and 442:
427 link to Fairtrade, in which Fai
- Page 443 and 444:
France: Producers and Competition 4
- Page 445 and 446:
UK: Producers and Competition 431 W
- Page 447 and 448:
that for Fairtrade to work it has t
- Page 449 and 450:
436 01/01/2007 01/01/2007 01/01/200
- Page 451 and 452:
438 01/01/2003 01/01/2003 01/01/200
- Page 453 and 454:
440 Jaworski, A. & Coupland, N. (19
- Page 455 and 456:
PART SEVEN: PUBLIC - PRIVATE PARTNE
- Page 457 and 458:
444 It also examines the applicabil
- Page 459 and 460:
446 critical resources controlled b
- Page 461 and 462:
448 In October 2008, NVPC launched
- Page 463 and 464:
S$1 policy but perhaps other more i
- Page 465 and 466:
References Azlan A, Lim LL, Yahya S
- Page 467 and 468:
PART EIGHT: CORPORATE RESPONSIBILIT
- Page 469 and 470:
organizations, with different aims
- Page 471 and 472:
458 Decentralization and local gove
- Page 473 and 474:
460 When multiple actors involved i
- Page 475 and 476:
462 Governance, economy, social cap
- Page 477 and 478:
464 In this sense, analysing a terr
- Page 479 and 480:
Partnerships Social Capital 466 - S
- Page 481 and 482:
468 The level of civic participatio
- Page 483 and 484:
Conclusion - Quality of the environ
- Page 485 and 486:
Garvin, T. et al. (2009). Community
- Page 487 and 488:
THE EFFECTS OF “DEPENDENCY” ON
- Page 489 and 490:
how, this dependence inhibits effec
- Page 491 and 492:
478 the MNC effectively. This secti
- Page 493 and 494:
480 regulation via CSR policy, whic
- Page 495 and 496:
482 potential consumer base in each
- Page 497 and 498:
References 484 An Roinn Gnóthaí P
- Page 499 and 500:
Lambe. A., Directors' Compliance St
- Page 501 and 502:
INVESTIGATING THE PRINCIPLES OF COR
- Page 503 and 504:
490 economic and institutional deve
- Page 505 and 506:
492 and corporate governance. The w
- Page 507 and 508:
494 corporate stakeholders, of weal
- Page 509 and 510:
496 failures by corporate boards to
- Page 511 and 512:
498 fashion", therefore I intend to
- Page 513 and 514:
ENVIRONMENTAL MANAGEMENT PRACTICES
- Page 515 and 516:
An Overview of Environmental Manage
- Page 517 and 518:
Feichtinger and Pregernig, 2005; Gr
- Page 519 and 520:
Survey Questionnaire 506 The raw da
- Page 521 and 522:
Table 4. Variables used to compute
- Page 523 and 524:
inhabitants and workers) and the ex
- Page 525 and 526:
512 particular purchase, the incent
- Page 527 and 528:
514 which limits the adoption of be
- Page 529 and 530:
Conclusions 516 The overall profile
- Page 531 and 532:
Cuthill, M. (2002). Exploratory res
- Page 533 and 534:
520 Lundberg, K., Balforsa, B. and
- Page 535 and 536:
RELATIONAL GOVERNANCE AND THE DEVEL
- Page 537 and 538:
524 national-level plans to constru
- Page 539 and 540:
Relational Governance 526 One of th
- Page 541 and 542:
Case Studies: Vankorneft and the Ev
- Page 543 and 544:
The shape of Russian public CSR pol
- Page 545 and 546:
Report on CSR in the forestry indus
- Page 547 and 548:
534 At the Turukhansk district leve
- Page 549 and 550:
536 Russian federal legislature vio
- Page 551 and 552:
538 The maintenance of the long-ter
- Page 553 and 554:
References 540 Albareda, L., Lozano
- Page 555 and 556:
542 Moon, J. (2004). Government as
- Page 557 and 558:
PART NINE: RENEWABLE ENERGY 544
- Page 559 and 560:
546 generating the various form of
- Page 561 and 562:
• The lack of basic infrastructur
- Page 563 and 564:
550 − A Tool for assessing the ec
- Page 565 and 566:
ARTICULATION OF ENVIRONMENTAL AND S
- Page 567 and 568:
- Cramer Commission56, - Renewable
- Page 569 and 570:
556 conditions + + + + + + + + Prop
- Page 571 and 572:
Figure 1 - Impacts of direct and in
- Page 573 and 574:
Figure 3 - Impacts of direct and in
- Page 575 and 576:
Figure 6 - Impacts of agricultural
- Page 577 and 578:
Agricultural practices have also im
- Page 579 and 580:
566 Nevertheless, land-use changes
- Page 581 and 582:
- Discussion possibilities, - Free
- Page 583 and 584:
References ACCS (2007a). AFS Standa
- Page 585 and 586:
Renewable Fuels Agency (2008), The
- Page 587 and 588:
Abstract SUPPLY CHAIN ISSUES OF BIO
- Page 589 and 590:
576 adjusted to the specific condit
- Page 591 and 592:
energy and logistics/SCM. Follow-up
- Page 593 and 594:
Madlener & Bachhiesl 2007 Perry & R
- Page 595 and 596:
Elghali et al. 2007 Madlener & Bach
- Page 597 and 598:
584 on the other hand state that a
- Page 599 and 600:
586 expeller, olive cake and wood p
- Page 601 and 602:
588 torrefaction and pelletisation
- Page 603 and 604:
Berglund, M. (2006). Biogas product
- Page 605 and 606:
SUSTAINABILITY CYCLE ASSESMENT OF B
- Page 607 and 608:
Figure 1. Cradle-to-grave grave app
- Page 609 and 610:
Table 1. Environmental, social cult
- Page 611 and 612:
Table 2. Environmental, social cult
- Page 613 and 614:
600 In summary, while biodiesel is
- Page 615 and 616: 602 nature after use: when the soli
- Page 617 and 618: 604 the creation, refinement, use a
- Page 619 and 620: Test Results 606 Biogases are envir
- Page 621 and 622: ID=78&articleID=1163 608 WCED (1987
- Page 623 and 624: 610 business of sustainability and
- Page 625 and 626: Table 2. The Equator Principles and
- Page 627 and 628: 614 Strategic orientation of firms
- Page 629 and 630: 616 Natural gas fuels over 99 perce
- Page 631 and 632: 618 building a Hydrogen Energy plan
- Page 633 and 634: 620 principles that are related to
- Page 635 and 636: Impact on Climate Change Conclusion
- Page 637 and 638: Falck, O. & Heblich, S. Corporate s
- Page 639 and 640: ROBIN HOOD THEOREM: A WAY FOR ENERG
- Page 641 and 642: 628 communities have to contend and
- Page 643 and 644: 630 to power basic devices like TV
- Page 645 and 646: References Abavana, G. C, (2004). G
- Page 647 and 648: INTRA-INDUSTRY IMITATION IN ENVIRON
- Page 649 and 650: 636 The legislation has also contri
- Page 651 and 652: In general, the larger the organisa
- Page 653 and 654: Content Analysis 640 In order to be
- Page 655 and 656: 642 One of the key questions in ass
- Page 657 and 658: Table 4. Stakeholder considered by
- Page 659 and 660: 646 Table 5. GRI indicators accordi
- Page 661 and 662: Refferences Adams, C.A. (2004). The
- Page 663 and 664: Gray, R. (2006). Does Sustainabilit
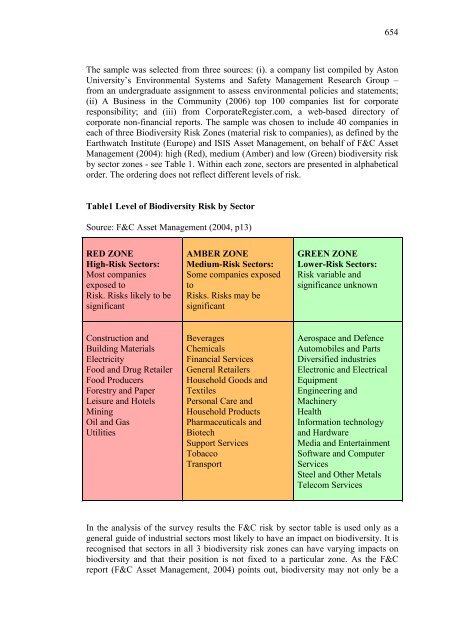
- Page 665: SUPPLY CHAIN CORPORATE RESPONSIBILI
- Page 669 and 670: Table 2 Survey Categories used to E
- Page 671 and 672: y reading the relevant sections. Th
- Page 673 and 674: 660 Perhaps not surprisingly compan
- Page 675 and 676: 662 Only 3 companies reported the e
- Page 677 and 678: iodiversity (IPES, 2008). The IPES
- Page 679 and 680: usiness level playing field and, wh
- Page 681 and 682: 668 EICC. (2006). Electronic Indust
- Page 683 and 684: PART ELEVEN: RESPONSIBLE LEADERSHIP
- Page 685 and 686: Value Basis 672 Finding one’s tru
- Page 687 and 688: 674 The lure of quick profits, stat
- Page 689 and 690: 676 politics he talked and wrote ab
- Page 691 and 692: The Responsible Leadership Identiti
- Page 693 and 694: villages of Bangladesh. He set up a
- Page 695 and 696: States: Building Blocks of Some Res
- Page 697 and 698: Conclusions Matching Individual, Or
- Page 699 and 700: 686 The different characteristics o
- Page 701 and 702: Issue: Corporate Responsibility & D
- Page 703 and 704: 690 society at large”. Other defi
- Page 705 and 706: Table 1. Reasons for implementing e
- Page 707 and 708: 694 environment and develop a bette
- Page 709 and 710: 696 Does this imply that corporate
- Page 711 and 712: and certifying environmental manage
- Page 713 and 714: Perspective from law, economics, an
- Page 715 and 716: 702 However neither Japan nor Germa
- Page 717 and 718:
704 community pressure, and environ
- Page 719 and 720:
706 international competitiveness (
- Page 721 and 722:
708 and Alberini 2002). The functio
- Page 723 and 724:
Public Politics and Private Politic
- Page 725 and 726:
these three actors have been strong
- Page 727 and 728:
714 Imura, H. (2005). Japan's Envir
- Page 729 and 730:
716 technical aspects of environmen
- Page 731 and 732:
718 However, a more in-depth discus
- Page 733 and 734:
720 empirically tested in a number
- Page 735 and 736:
722 the level of awareness and envi
- Page 737 and 738:
724 solutions might even exaggerate
- Page 739 and 740:
References Albrecht, D., Bultena, G
- Page 741 and 742:
728 Klein, K. J. & Kozlowski, S. W.
- Page 743 and 744:
PART TWELVE: SMEs & CORPORATE RESPO
- Page 745 and 746:
732 SMEs, Training and Sustainabili
- Page 747 and 748:
734 The values of an SME are predom
- Page 749 and 750:
SMEs, but these have rarely lived u
- Page 751 and 752:
738 believe that this course of act
- Page 753 and 754:
(Revell and Rutherfoord, 2003). The
- Page 755 and 756:
Diagram 2: Conceptual Framework - F
- Page 757 and 758:
Reference 744 Ammenberg, J. and Hje
- Page 759 and 760:
746 Hall, G, 1989). Lack of Finance
- Page 761 and 762:
748 Sheridan, P., (2001). Directors
- Page 763 and 764:
750 theories focus on the transfera
- Page 765 and 766:
752 traditional models of managemen
- Page 767 and 768:
end of the fifth year of life marks
- Page 769 and 770:
Figure 1 The model The Research The
- Page 771 and 772:
The Area Selected and the Ccow Buff
- Page 773 and 774:
760 The Plan must guarantee the att
- Page 775 and 776:
Managerial Implications, Limits of
- Page 777 and 778:
Freeman R.E. (1984). Strategic Mana
- Page 779 and 780:
CSR-TOOLS FOR SMEs - COMPARATIVE AN
- Page 781 and 782:
Features of CSR in SMEs 768 CSR was
- Page 783 and 784:
770 mostly provide overviews and in
- Page 785 and 786:
772 The CSR Quality Seal is essenti
- Page 787 and 788:
774 into its strategic as well as o
- Page 789 and 790:
Outcome and Conclusions 776 BLISS w
- Page 791 and 792:
References Bhuiyan, N. & Bagehel, A
- Page 793 and 794:
780 Honen, P. & Potts, J. (2007). C
- Page 795 and 796:
782 SUPPLY - CHAIN ENVIRONMENTAL MA
- Page 797 and 798:
784 offers a useful discussion and
- Page 799 and 800:
786 22’ noted by Fanshawe (2000)
- Page 801 and 802:
788 action) and the sense made of t
- Page 803 and 804:
790 The latter provided clear benef
- Page 805 and 806:
792 Figure 3 - Describing the Behav
- Page 807 and 808:
794 Interestingly though, and despi
- Page 809 and 810:
Summary and Comment 796 In the earl
- Page 811 and 812:
de Wit, B. and Meyer, R. (1999). St
- Page 813 and 814:
Remenyi, D., Williams, B., Money, A
- Page 815 and 816:
FACTORS AFFECTING THE ENGAGING IN C
- Page 817 and 818:
804 this issue can be examined with
- Page 819 and 820:
Table 1 List of factors affecting f
- Page 821 and 822:
voluntariness” proposed by Moore
- Page 823 and 824:
Table 2: The state of CSR practices
- Page 825 and 826:
Table 3 Factor analysis: variables
- Page 827 and 828:
814 However, there are also challen
- Page 829 and 830:
Grayson, D. (2004). How CSR Contrib
- Page 831 and 832:
Spence, L. J. , & Rutherfoord, R. (
- Page 833 and 834:
820 This paper draws on both primar
- Page 835 and 836:
Case Studies 822 The case studies e
- Page 837 and 838:
Rationale and Start up 824 In this
- Page 839 and 840:
826 own standards, and those of her
- Page 841 and 842:
828 Finally all three of these case
- Page 843 and 844:
References Journal Articles 830 Goo
- Page 845 and 846:
CORPORATE RESPONSIBILITY: A CRICIAL
- Page 847 and 848:
834 The most visible parts of the c
- Page 849 and 850:
Accordingly, referring to Basu and
- Page 851 and 852:
measures on the other hand show hug
- Page 853 and 854:
policies are accompanied by company
- Page 855 and 856:
Conclusion 842 The described percep
- Page 857 and 858:
Eckert, S. et al. (2007). Nachhalti
- Page 859 and 860:
Nielsen, A.E. & Thomsen, C. (2009)
- Page 861 and 862:
PART THIRTEEN: CONSUMERS AND ETHICS
- Page 863 and 864:
850 (www.fairtrade.net). Different
- Page 865 and 866:
852 Organizations International) an
- Page 867 and 868:
854 The first step of the research
- Page 869 and 870:
Table 1- Knowledge measurement stat
- Page 871 and 872:
• Quality aspect: quality of the
- Page 873 and 874:
References Blowfield, Mick. (2003).
- Page 875 and 876:
GAMBLING, SMOKING AND DRINKING: WHA
- Page 877 and 878:
864 assistance was given by license
- Page 879 and 880:
261) suggested that they had some i
- Page 881 and 882:
868 or banned altogether. Only one
- Page 883 and 884:
Lantos, G.P. (1999). ‘Motivating


