

La sostenibilidad del desarrollo a 20 años de la cumbre para la tierra: avances, brechas y lineamientos estratégicos para América Latina y el Caribe
En diciembre de 2009 la Asamblea General aprobó la resolución 64/236, en virtud de la cual decidió organizar la Conferencia de las Naciones Unidas sobre el Desarrollo Sostenible. Esta Conferencia se realizará en Río de Janeiro (Brasil) en junio de 2012, 20 años después de la Conferencia de las Naciones Unidas sobre el Medio Ambiente y el Desarrollo, conocida como Cumbre para la Tierra, y constituye una oportunidad histórica para hacer un balance de lo sucedido en estas dos décadas, evaluar los advances logrados y las dificultades encontradas y explorar nuevas formas de cooperación que permitan acelerar la transición hacia un desarrollo sostenible.
En diciembre de 2009 la Asamblea General aprobó la resolución 64/236, en virtud de la cual decidió organizar la Conferencia de las Naciones Unidas sobre el Desarrollo Sostenible. Esta Conferencia se realizará en Río de Janeiro (Brasil) en junio de 2012, 20 años después de la Conferencia de las Naciones Unidas sobre el Medio Ambiente y el Desarrollo, conocida como Cumbre para la Tierra, y constituye una oportunidad histórica para hacer un balance de lo sucedido en estas dos décadas, evaluar los advances logrados y las dificultades encontradas y explorar nuevas formas de cooperación que permitan acelerar la transición hacia un desarrollo sostenible.

You also want an ePaper? Increase the reach of your titles
YUMPU automatically turns print PDFs into web optimized ePapers that Google loves.
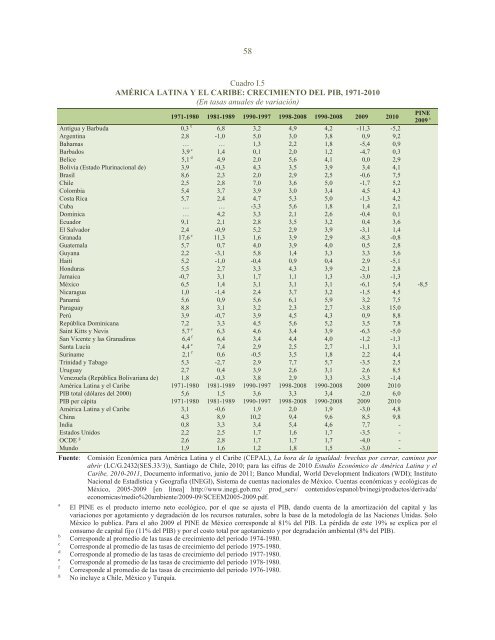
58<br />
Cuadro I.5<br />
AMÉRICA LATINA Y EL CARIBE: CRECIMIENTO DEL PIB, 1971-<strong>20</strong>10<br />
(En tasas anuales <strong>de</strong> variación)<br />
1971-1980 1981-1989 1990-1997 1998-<strong>20</strong>08 1990-<strong>20</strong>08 <strong>20</strong>09 <strong>20</strong>10<br />
PINE<br />
<strong>20</strong>09 a<br />
Antigua y Barbuda 0,3 b 6,8 3,2 4,9 4,2 -11,3 -5,2<br />
Argentina 2,8 -1,0 5,0 3,0 3,8 0,9 9,2<br />
Bahamas … … 1,3 2,2 1,8 -5,4 0,9<br />
Barbados 3,9 c 1,4 0,1 2,0 1,2 -4,7 0,3<br />
B<strong>el</strong>ice 5,1 d 4,9 2,0 5,6 4,1 0,0 2,9<br />
Bolivia (Estado Plurinacional <strong>de</strong>) 3,9 -0,3 4,3 3,5 3,9 3,4 4,1<br />
Brasil 8,6 2,3 2,0 2,9 2,5 -0,6 7,5<br />
Chile 2,5 2,8 7,0 3,6 5,0 -1,7 5,2<br />
Colombia 5,4 3,7 3,9 3,0 3,4 4,5 4,3<br />
Costa Rica 5,7 2,4 4,7 5,3 5,0 -1,3 4,2<br />
Cuba … … -3,3 5,6 1,8 1,4 2,1<br />
Dominica … 4,2 3,3 2,1 2,6 -0,4 0,1<br />
Ecuador 9,1 2,1 2,8 3,5 3,2 0,4 3,6<br />
El Salvador 2,4 -0,9 5,2 2,9 3,9 -3,1 1,4<br />
Granada 17,6 e 11,3 1,6 3,9 2,9 -8,3 -0,8<br />
Guatema<strong>la</strong> 5,7 0,7 4,0 3,9 4,0 0,5 2,8<br />
Guyana 2,2 -3,1 5,8 1,4 3,3 3,3 3,6<br />
Haití 5,2 -1,0 -0,4 0,9 0,4 2,9 -5,1<br />
Honduras 5,5 2,7 3,3 4,3 3,9 -2,1 2,8<br />
Jamaica -0,7 3,1 1,7 1,1 1,3 -3,0 -1,3<br />
México 6,5 1,4 3,1 3,1 3,1 -6,1 5,4 -8,5<br />
Nicaragua 1,0 -1,4 2,4 3,7 3,2 -1,5 4,5<br />
Panamá 5,6 0,9 5,6 6,1 5,9 3,2 7,5<br />
Paraguay 8,8 3,1 3,2 2,3 2,7 -3,8 15,0<br />
Perú 3,9 -0,7 3,9 4,5 4,3 0,9 8,8<br />
República Dominicana 7,2 3,3 4,5 5,6 5,2 3,5 7,8<br />
Saint Kitts y Nevis 5,7 e 6,3 4,6 3,4 3,9 -6,3 -5,0<br />
San Vicente y <strong>la</strong>s Granadinas 6,4 f 6,4 3,4 4,4 4,0 -1,2 -1,3<br />
Santa Lucía 4,4 e 7,4 2,9 2,5 2,7 -1,1 3,1<br />
Suriname 2,1 f 0,6 -0,5 3,5 1,8 2,2 4,4<br />
Trinidad y Tabago 5,3 -2,7 2,9 7,7 5,7 -3,5 2,5<br />
Uruguay 2,7 0,4 3,9 2,6 3,1 2,6 8,5<br />
Venezue<strong>la</strong> (República Bolivariana <strong>de</strong>) 1,8 -0,3 3,8 2,9 3,3 -3,3 -1,4<br />
<strong>América</strong> <strong>La</strong>tina y <strong>el</strong> <strong>Caribe</strong> 1971-1980 1981-1989 1990-1997 1998-<strong>20</strong>08 1990-<strong>20</strong>08 <strong>20</strong>09 <strong>20</strong>10<br />
PIB total (dó<strong>la</strong>res <strong><strong>de</strong>l</strong> <strong>20</strong>00) 5,6 1,5 3,6 3,3 3,4 -2,0 6,0<br />
PIB per cápita 1971-1980 1981-1989 1990-1997 1998-<strong>20</strong>08 1990-<strong>20</strong>08 <strong>20</strong>09 <strong>20</strong>10<br />
<strong>América</strong> <strong>La</strong>tina y <strong>el</strong> <strong>Caribe</strong> 3,1 -0,6 1,9 2,0 1,9 -3,0 4,8<br />
China 4,3 8,9 10,2 9,4 9,6 8,5 9,8<br />
India 0,8 3,3 3,4 5,4 4,6 7,7 -<br />
Estados Unidos 2,2 2,5 1,7 1,6 1,7 -3,5 -<br />
OCDE g 2,6 2,8 1,7 1,7 1,7 -4,0 -<br />
Mundo 1,9 1,6 1,2 1,8 1,5 -3,0 -<br />
Fuente: Comisión Económica <strong>para</strong> <strong>América</strong> <strong>La</strong>tina y <strong>el</strong> <strong>Caribe</strong> (CEPAL), <strong>La</strong> hora <strong>de</strong> <strong>la</strong> igualdad: <strong>brechas</strong> por cerrar, caminos por<br />
abrir (LC/G.2432(SES.33/3)), Santiago <strong>de</strong> Chile, <strong>20</strong>10; <strong>para</strong> <strong>la</strong>s cifras <strong>de</strong> <strong>20</strong>10 Estudio Económico <strong>de</strong> <strong>América</strong> <strong>La</strong>tina y <strong>el</strong><br />
<strong>Caribe</strong>, <strong>20</strong>10-<strong>20</strong>11, Documento informativo, junio <strong>de</strong> <strong>20</strong>11; Banco Mundial, World Dev<strong>el</strong>opment Indicators (WDI); Instituto<br />
Nacional <strong>de</strong> Estadística y Geografía (INEGI), Sistema <strong>de</strong> cuentas nacionales <strong>de</strong> México. Cuentas económicas y ecológicas <strong>de</strong><br />
México, <strong>20</strong>05-<strong>20</strong>09 [en línea] http://www.inegi.gob.mx/ prod_serv/ contenidos/espanol/bvinegi/productos/<strong>de</strong>rivada/<br />
economicas/medio%<strong>20</strong>ambiente/<strong>20</strong>09-09/SCEEM<strong>20</strong>05-<strong>20</strong>09.pdf.<br />
a<br />
El PINE es <strong>el</strong> producto interno neto ecológico, por <strong>el</strong> que se ajusta <strong>el</strong> PIB, dando cuenta <strong>de</strong> <strong>la</strong> amortización <strong><strong>de</strong>l</strong> capital y <strong>la</strong>s<br />
variaciones por agotamiento y <strong>de</strong>gradación <strong>de</strong> los recursos naturales, sobre <strong>la</strong> base <strong>de</strong> <strong>la</strong> metodología <strong>de</strong> <strong>la</strong>s Naciones Unidas. Solo<br />
México lo publica. Para <strong>el</strong> año <strong>20</strong>09 <strong>el</strong> PINE <strong>de</strong> México correspon<strong>de</strong> al 81% <strong><strong>de</strong>l</strong> PIB. <strong>La</strong> pérdida <strong>de</strong> este 19% se explica por <strong>el</strong><br />
consumo <strong>de</strong> capital fijo (11% <strong><strong>de</strong>l</strong> PIB) y por <strong>el</strong> costo total por agotamiento y por <strong>de</strong>gradación ambiental (8% <strong><strong>de</strong>l</strong> PIB).<br />
b<br />
Correspon<strong>de</strong> al promedio <strong>de</strong> <strong>la</strong>s tasas <strong>de</strong> crecimiento <strong><strong>de</strong>l</strong> período 1974-1980.<br />
c<br />
Correspon<strong>de</strong> al promedio <strong>de</strong> <strong>la</strong>s tasas <strong>de</strong> crecimiento <strong><strong>de</strong>l</strong> período 1975-1980.<br />
d<br />
Correspon<strong>de</strong> al promedio <strong>de</strong> <strong>la</strong>s tasas <strong>de</strong> crecimiento <strong><strong>de</strong>l</strong> período 1977-1980.<br />
e<br />
Correspon<strong>de</strong> al promedio <strong>de</strong> <strong>la</strong>s tasas <strong>de</strong> crecimiento <strong><strong>de</strong>l</strong> período 1978-1980.<br />
f<br />
Correspon<strong>de</strong> al promedio <strong>de</strong> <strong>la</strong>s tasas <strong>de</strong> crecimiento <strong><strong>de</strong>l</strong> período 1976-1980.<br />
g<br />
No incluye a Chile, México y Turquía.


