- Page 1 and 2:
Public Disclosure Authorized Public
- Page 3 and 4:
EXECUTIVE SUMMARY INTRODUCTION Azur
- Page 5 and 6:
• Screening and scoping • Basel
- Page 7 and 8:
In addition to predicted impacts fr
- Page 9 and 10:
International Standards and Guideli
- Page 11 and 12:
Figure 1 Layout of Proposed Power P
- Page 13 and 14:
Type of Emission Solid waste All so
- Page 15 and 16:
NIPP were used for NO 2. The result
- Page 17 and 18:
analysis are both qualitative and q
- Page 19 and 20:
other forms of salary jobs or servi
- Page 21 and 22:
Table 4 Summary of Impacts, Mitigat
- Page 23 and 24:
Impact Impact Description Phase Pre
- Page 25 and 26:
Impact Impact Description Phase Pre
- Page 27 and 28:
Impact Impact Description Phase Pre
- Page 29 and 30:
Impact Impact Description Phase Pre
- Page 31 and 32:
Impact Impact Description Phase Pre
- Page 33 and 34:
Box 2 Mitigation Hierarchy for Plan
- Page 35 and 36:
safety impacts are reduced to minor
- Page 37 and 38:
5.2 METHODOLOGY 5-2 5.3 DEMOGRAPHIC
- Page 39 and 40:
Annex G - Unplanned Events and Emer
- Page 41 and 42:
IAEA International Atomic Energy Ag
- Page 43 and 44:
1 INTRODUCTION 1.1 BACKGROUND This
- Page 45 and 46:
1.2.2 Project Context The Project w
- Page 47 and 48:
Table 1.1 The EIA Team Name Organis
- Page 49 and 50:
EIA, sampling has been completed fo
- Page 51 and 52:
events is therefore assessed in ter
- Page 53 and 54:
Federal Ministry of Environment Pri
- Page 55 and 56:
Edo State Waste Management Board Th
- Page 57 and 58:
The proposed Project requires an EI
- Page 59 and 60:
as a building or irrigation system)
- Page 61 and 62:
instrument for monitoring and contr
- Page 63 and 64:
Convention Concerning the Protectio
- Page 65 and 66:
Box 1.2 World Bank Safeguard Polici
- Page 67 and 68:
• Step 5. Stakeholder Consultatio
- Page 69 and 70:
Chapter Title Description 8 Mitigat
- Page 71 and 72:
commensurate sums that will need to
- Page 73 and 74:
operation of the Project. The imple
- Page 75 and 76:
2.4.3 Social Sustainability A detai
- Page 77 and 78:
signing of a Memorandum of Understa
- Page 79 and 80:
Key Component OCGT Associated Machi
- Page 81 and 82:
Gas Turbine Building The four gas t
- Page 83 and 84:
Government parastatal that has been
- Page 85 and 86:
3.2.10 Fire Protection The gas turb
- Page 87 and 88:
foundations and is associated with
- Page 89 and 90:
SI. No Waste Water 3. Water Based S
- Page 91 and 92:
3.3.4 Administration Buildings The
- Page 93 and 94:
the area reserved for the HRSG and
- Page 95 and 96:
3.6 OPERATION 3.6.1 Maintenance It
- Page 97 and 98:
Job title Level of Skill Business M
- Page 99 and 100:
Figure 3.2 Staff Organogram Plant M
- Page 101 and 102:
3.8.2 Alternative Site Location Sev
- Page 103 and 104:
the next 20 years, the vast bulk of
- Page 105 and 106:
climate but straddles the Tropical
- Page 107 and 108:
The relative humidity of Nigeria is
- Page 109 and 110:
4.4 GEOLOGY The Study Area is locat
- Page 111 and 112:
4.5.1 Soil Types 4.5.2 Soil Quality
- Page 113 and 114:
season and were observably lower du
- Page 115 and 116:
increased with depth, showing a sig
- Page 117 and 118:
subsoil (15.00 - 35.00 x 10 3 cfu/g
- Page 119 and 120:
higher heterotrophic fungi concentr
- Page 121 and 122:
The results of the inorganic and or
- Page 123 and 124:
cfu/100ml at Orior-Osemwende during
- Page 125 and 126:
Air quality measurements were taken
- Page 127 and 128:
Figure 4.6 Sampling Locations for N
- Page 129 and 130:
Sample Code Noise Level - dB (A) A7
- Page 131 and 132:
Figure 4.7 Sampling Points ((Flora)
- Page 133 and 134:
All flora habitats surveyed were fo
- Page 135 and 136:
Figure 4.12 Fallow Land with Guinea
- Page 137 and 138:
Figure 4.16 A view of re-growing se
- Page 139 and 140:
Figure 4.19 Plant Species Discorea
- Page 141 and 142:
Conservation Status Scientific Name
- Page 143 and 144:
Species identified in the project a
- Page 145 and 146:
Urho-Nisen-Urho-Nisen, which will b
- Page 147 and 148:
• Participation of those with acc
- Page 149 and 150:
Table 5.2 Key Socio-Economic Indica
- Page 151 and 152:
Figure 5.3 Age Distribution, Edo St
- Page 153 and 154:
were classed as vulnerable by virtu
- Page 155 and 156:
Orior-Osemwende Orior-Osemwende is
- Page 157 and 158:
the communities within the Project
- Page 159 and 160:
Figure 5.6 Traditional Leadership S
- Page 161 and 162:
conflict could be a problem in the
- Page 163 and 164:
There are distinct gender divisions
- Page 165 and 166:
Petty Trading According to FGDs som
- Page 167 and 168:
the house. Almost a quarter of hous
- Page 169 and 170: have no formal schooling; while app
- Page 171 and 172: Name of sacred site worshipped in c
- Page 173 and 174: Figure 5.11 Map showing the locatio
- Page 175 and 176: stretches of the walls and moats re
- Page 177 and 178: Figure 5.14 The Location of Moats S
- Page 179 and 180: native doctors or herbalists. With
- Page 181 and 182: project and its potential impacts (
- Page 183 and 184: The Project identified the Nigerian
- Page 185 and 186: Figure 6.2 Community Engagement in
- Page 187 and 188: Figure 6.6 Consultation with the Ed
- Page 189 and 190: Details of the asset census survey
- Page 191 and 192: Stakeholder Engagement Engagement A
- Page 193 and 194: 6.5 KEY ISSUES RAISED This section
- Page 195 and 196: 6.6 PROJECT GRIEVANCE MECHANISM Gri
- Page 197 and 198: to ensure that projects can proceed
- Page 199 and 200: 7 BIOPHYSICAL AND SOCIO-ECONOMIC IM
- Page 201 and 202: 2. Evaluation of the importance (or
- Page 203 and 204: In addition to predicted impacts, t
- Page 205 and 206: Significance for Socio-economic Imp
- Page 207 and 208: Table 7.2 Species Value / Sensitivi
- Page 209 and 210: Box 7.4 Mitigation Hierarchy for Pl
- Page 211 and 212: AERMOD is considered to be appropri
- Page 213 and 214: Figure 7.2 Wind Roses for Bohicon,
- Page 215 and 216: Country Averaging period Recommende
- Page 217 and 218: The WHO guidelines are particularly
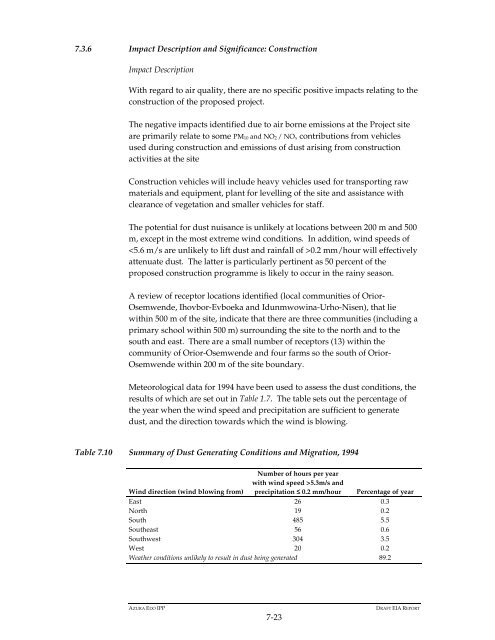
- Page 219: 7.3.5 Receptors per year for a sing
- Page 223 and 224: Process Emissions: NO x and CO The
- Page 225 and 226: Figure 7.5 1 h maximum NO 2, the Pr
- Page 227 and 228: 7.3.9 Impact Description and Signif
- Page 229 and 230: The values in Table 7.13 will there
- Page 231 and 232: impacts exactly or take account of
- Page 233 and 234: Figure 7.6 Operational noise levels
- Page 235 and 236: also be required for the burial of
- Page 237 and 238: 7.5.4 Impact Description and Signif
- Page 239 and 240: The impact of the Project on water
- Page 241 and 242: 7.6.4 Impact Description and Signif
- Page 243 and 244: Artanema longifolium (a flowering p
- Page 245 and 246: Table 7.18 Summary of Impact Signif
- Page 247 and 248: The site will also generate general
- Page 249 and 250: include estimates for the physical
- Page 251 and 252: 7.9.2 Impact Description and Signif
- Page 253 and 254: 7.10.2 Impact Description and Signi
- Page 255 and 256: for impacts to demographics during
- Page 257 and 258: As discussed above, and due to the
- Page 259 and 260: Project’s construction phase will
- Page 261 and 262: during decommissioning is expected
- Page 263 and 264: Due to the high unemployment rate i
- Page 265 and 266: contract workers. An additional num
- Page 267 and 268: enefit the local communities. These
- Page 269 and 270: impact on a small number of inhabit
- Page 271 and 272:
Besides the construction of the pla
- Page 273 and 274:
• Psychological impacts associate
- Page 275 and 276:
7.15.4 Impact Description and Signi
- Page 277 and 278:
Impact Significance The extent of t
- Page 279 and 280:
• Bitumen shall not be overheated
- Page 281 and 282:
8.2.2 Operation With the implementa
- Page 283 and 284:
• Oil interceptors and silt traps
- Page 285 and 286:
• All surface water or other cont
- Page 287 and 288:
• Reduce or prevent off-site sedi
- Page 289 and 290:
8.5.2 Operation • After construct
- Page 291 and 292:
8.6.2 Operation • Waste shall be
- Page 293 and 294:
8.8 ECONOMIC RESETTLEMENT As noted
- Page 295 and 296:
impacts over the operations period.
- Page 297 and 298:
Effective and ongoing implementatio
- Page 299 and 300:
• Frequent and regular disclosure
- Page 301 and 302:
8.12.2 Operational The mitigation m
- Page 303 and 304:
8.13.2 Operation reduce the potenti
- Page 305 and 306:
• Personal Protective Equipment (
- Page 307 and 308:
8.14.3 Decommissioning The health a
- Page 309 and 310:
Figure 9.1 Annual mean NO 2, cumula
- Page 311 and 312:
Table 9.1 Summary of cumulative imp
- Page 313 and 314:
impact is not due to the operation
- Page 315 and 316:
9.3 SOILS AND GEOLOGY The implement
- Page 317 and 318:
9.10 EMPLOYMENT AND ECONOMY The Pro
- Page 319 and 320:
10 ENVIRONMENTAL AND SOCIAL MANAGEM
- Page 321 and 322:
Table 10.1 Environmental Management
- Page 323 and 324:
10.2.2 Communication Azura Power wi
- Page 325 and 326:
The management of change procedure
- Page 327 and 328:
Impacts Management Plans Impacts to
- Page 329 and 330:
frequency of this reporting will be
- Page 331 and 332:
Ref # Potential impact Desired Outc
- Page 333 and 334:
Table 10.4 Construction Phase: Envi
- Page 335 and 336:
Ref # Potential impact contaminatio
- Page 337 and 338:
Ref # Potential impact Desired Outc
- Page 339 and 340:
Ref # Potential impact applied work
- Page 341 and 342:
Ref # Potential impact safety impac
- Page 343 and 344:
Table 10.5 Operational Phase: Envir
- Page 345 and 346:
Ref # Potential impact 3.4 Water Re
- Page 347 and 348:
Ref # Potential impact Desired Outc
- Page 349 and 350:
Ref # Potential impact 3.10 Impacts
- Page 351 and 352:
Ref # Potential impact 3.12 Potenti
- Page 353 and 354:
Ref # Potential impact Desired Outc
- Page 355 and 356:
Ref # Potential impact Desired Outc
- Page 357 and 358:
Ref # Potential impact Desired Outc
- Page 359 and 360:
Ref # Potential impact Desired Outc
- Page 361 and 362:
Ref # Potential impact Desired Outc
- Page 363 and 364:
impacts were considered to be negli
- Page 365 and 366:
Federal Environmental Protection Ag
- Page 367:
World Health Organization (2007) pH