- Page 3:
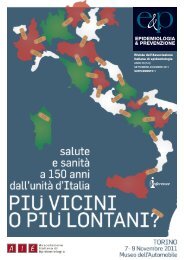
29°Convegno annuale di epidemiolog
- Page 7:
Indice Programma del Convegno Abstr
- Page 11 and 12:
3° Corso AULA 28 La comunicazione
- Page 13 and 14:
IL CONVEGNO AIE 2005 REGISTRAZIONI
- Page 15 and 16:
ORE 15 - Sessione B2 - AULA 27 Mode
- Page 17 and 18:
38-Mannocci A, La Torre G, Miele L,
- Page 19 and 20:
30-Arrieta Arroyo A, Guillen-Grima
- Page 21 and 22:
L’ASSEMBLEA A.I.E All’assemblea
- Page 23 and 24:
9 settembre ore 14.30 - 16.00 Audit
- Page 25:
9 settembre ore 16.00 - 17.30 Audit
- Page 29 and 30:
comunicazioni libere - sessione A1
- Page 31 and 32:
comunicazioni libere - sessione A1
- Page 33:
comunicazioni libere - sessione A1
- Page 36 and 37:
7 settembre sessione A1 - comunicaz
- Page 39 and 40:
comunicazioni libere - sessione A1
- Page 41 and 42:
comunicazioni libere - sessione A1
- Page 43 and 44:
comunicazioni libere - sessione B1
- Page 45 and 46:
comunicazioni libere - sessione B1
- Page 47 and 48:
comunicazioni libere - sessione B1
- Page 49:
comunicazioni libere - sessione B1
- Page 52 and 53:
7 settembre sessione B1 - comunicaz
- Page 54 and 55:
7 settembre sessione B1 - comunicaz
- Page 56 and 57:
7 settembre sessione C1 - comunicaz
- Page 58 and 59:
7 settembre sessione C1 - comunicaz
- Page 61 and 62:
comunicazioni libere - sessione C1
- Page 63 and 64:
comunicazioni libere - sessione C1
- Page 65 and 66:
comunicazioni libere - sessione C1
- Page 67 and 68:
comunicazioni libere - sessione C1
- Page 69 and 70:
poster 7 settembre SPLINE MODELS PE
- Page 71 and 72:
poster 7 settembre I RICOVERI OSPED
- Page 73:
poster 7 settembre EFFETTI A LUNGO
- Page 76 and 77:
7 settembre poster forte clusterizz
- Page 78 and 79: 7 settembre poster letteratura. A r
- Page 80 and 81: 7 settembre poster Conclusioni La c
- Page 83 and 84: poster 7 settembre PREVENZIONE DEL
- Page 85 and 86: poster 7 settembre LINEE GUIDA PER
- Page 87: poster 7 settembre MORTALITÀ E RIC
- Page 90 and 91: 7 settembre poster Ricoveri nel per
- Page 93 and 94: poster 7 settembre “NUOVO CODICE
- Page 95 and 96: poster 7 settembre MIGLIORARE LA QU
- Page 97 and 98: poster 7 settembre ACCESSO ALLE CUR
- Page 99 and 100: poster 7 settembre PERCORSO DI MIGL
- Page 101 and 102: poster 7 settembre VALUTAZIONE DELL
- Page 103 and 104: poster 7 settembre LA SOPRAVVIVENZA
- Page 105 and 106: poster 7 settembre IL PROFILO DI SA
- Page 107: poster 7 settembre ANALISI DELLA MO
- Page 110 and 111: 7 settembre poster network di Istit
- Page 112 and 113: 7 settembre poster LA QUALITÀ DELL
- Page 114 and 115: 7 settembre poster miglioramento me
- Page 117 and 118: poster 7 settembre STIMA DELL’ABI
- Page 119: poster 7 settembre Tabella 1: Assoc
- Page 122 and 123: 7 settembre poster L’aumento di p
- Page 125 and 126: poster 7 settembre DIFFUSIONE E SPE
- Page 127: poster 7 settembre EFFETTI DELL’A
- Page 132 and 133: 7 settembre poster Un presupposto d
- Page 134 and 135: 7 settembre poster CONSUMO DI ANTIM
- Page 136 and 137: 7 settembre poster FATTORI DI RISCH
- Page 138 and 139: 7 settembre poster Discussione Prob
- Page 140 and 141: 7 settembre poster Conclusioni L’
- Page 143 and 144: poster 7 settembre IL MODELLO DI GA
- Page 145 and 146: poster 7 settembre INTERVENTI DI RE
- Page 147 and 148: poster 7 settembre STUDIO OSSERVAZI
- Page 149 and 150: poster 7 settembre L’EVOLUZIONE D
- Page 151: 8 settembre 2005
- Page 154 and 155: 8 settembre gruppi che fanno epidem
- Page 156 and 157: 8 settembre gruppi che fanno epidem
- Page 158 and 159: 8 settembre gruppi che fanno epidem
- Page 160 and 161: 8 settembre gruppi che fanno epidem
- Page 162 and 163: 8 settembre gruppi che fanno epidem
- Page 165 and 166: gruppi che fanno epidemiologia 8 se
- Page 167 and 168: gruppi che fanno epidemiologia 8 se
- Page 169 and 170: gruppi che fanno epidemiologia 8 se
- Page 171: gruppi che fanno epidemiologia 8 se
- Page 174 and 175: 8 settembre gruppi che fanno epidem
- Page 176 and 177: 8 settembre gruppi che fanno epidem
- Page 178 and 179:
8 settembre gruppi che fanno epidem
- Page 181 and 182:
gruppi che fanno epidemiologia 8 se
- Page 183 and 184:
gruppi che fanno epidemiologia 8 se
- Page 185:
gruppi che fanno epidemiologia 8 se
- Page 188 and 189:
8 settembre gruppi che fanno epidem
- Page 190 and 191:
8 settembre gruppi che fanno epidem
- Page 193 and 194:
gruppi che fanno epidemiologia 8 se
- Page 195 and 196:
gruppi che fanno epidemiologia 8 se
- Page 197 and 198:
gruppi che fanno epidemiologia 8 se
- Page 199:
gruppi che fanno epidemiologia 8 se
- Page 202 and 203:
8 settembre gruppi che fanno epidem
- Page 204 and 205:
8 settembre gruppi che fanno epidem
- Page 206 and 207:
8 settembre gruppi che fanno epidem
- Page 208 and 209:
8 settembre gruppi che fanno epidem
- Page 210 and 211:
8 settembre gruppi che fanno epidem
- Page 212 and 213:
8 settembre gruppi che fanno epidem
- Page 214 and 215:
8 settembre gruppi che fanno epidem
- Page 217 and 218:
gruppi che fanno epidemiologia 8 se
- Page 219 and 220:
gruppi che fanno epidemiologia 8 se
- Page 221 and 222:
gruppi che fanno epidemiologia 8 se
- Page 223 and 224:
gruppi che fanno epidemiologia 8 se
- Page 225 and 226:
gruppi che fanno epidemiologia 8 se
- Page 227:
gruppi che fanno epidemiologia 8 se
- Page 230 and 231:
8 settembre gruppi che fanno epidem
- Page 233 and 234:
gruppi che fanno epidemiologia 8 se
- Page 235 and 236:
gruppi che fanno epidemiologia 8 se
- Page 237 and 238:
gruppi che fanno epidemiologia 8 se
- Page 239 and 240:
gruppi che fanno epidemiologia 8 se
- Page 241:
gruppi che fanno epidemiologia 8 se
- Page 244 and 245:
8 settembre gruppi che fanno epidem
- Page 247 and 248:
gruppi che fanno epidemiologia 8 se
- Page 249 and 250:
gruppi che fanno epidemiologia 8 se
- Page 251 and 252:
gruppi che fanno epidemiologia 8 se
- Page 253 and 254:
gruppi che fanno epidemiologia 8 se
- Page 255 and 256:
gruppi che fanno epidemiologia 8 se
- Page 257:
Il centro studi GISED è fortemente
- Page 260 and 261:
8 settembre gruppi che fanno epidem
- Page 262 and 263:
8 settembre gruppi che fanno epidem
- Page 264 and 265:
8 settembre gruppi che fanno epidem
- Page 267 and 268:
gruppi che fanno epidemiologia 8 se
- Page 269:
gruppi che fanno epidemiologia 8 se
- Page 272 and 273:
8 settembre gruppi che fanno epidem
- Page 274 and 275:
8 settembre gruppi che fanno epidem
- Page 277 and 278:
gruppi che fanno epidemiologia 8 se
- Page 279 and 280:
gruppi che fanno epidemiologia 8 se
- Page 281 and 282:
gruppi che fanno epidemiologia 8 se
- Page 283 and 284:
gruppi che fanno epidemiologia 8 se
- Page 285 and 286:
gruppi che fanno epidemiologia 8 se
- Page 287:
gruppi che fanno epidemiologia 8 se
- Page 290 and 291:
8 settembre sessione A2 - comunicaz
- Page 292 and 293:
8 settembre sessione A2 - comunicaz
- Page 294 and 295:
8 settembre sessione A2 - comunicaz
- Page 296 and 297:
8 settembre sessione A2 - comunicaz
- Page 299 and 300:
comunicazioni libere - sessione A2
- Page 301 and 302:
comunicazioni libere - sessione A2
- Page 303 and 304:
comunicazioni libere - sessione B2
- Page 305:
comunicazioni libere - sessione B2
- Page 308 and 309:
8 settembre sessione B2 - comunicaz
- Page 310 and 311:
8 settembre sessione B2 - comunicaz
- Page 312 and 313:
8 settembre sessione B2 - comunicaz
- Page 314 and 315:
8 settembre sessione B2 - comunicaz
- Page 316 and 317:
8 settembre sessione C2 - comunicaz
- Page 318 and 319:
8 settembre sessione C2 - comunicaz
- Page 321 and 322:
comunicazioni libere - sessione C2
- Page 323:
comunicazioni libere - sessione C2
- Page 326 and 327:
8 settembre sessione C2 - comunicaz
- Page 328 and 329:
8 settembre sessione A3 - comunicaz
- Page 330 and 331:
8 settembre sessione A3 - comunicaz
- Page 332 and 333:
8 settembre sessione A3 - comunicaz
- Page 334 and 335:
8 settembre sessione A3 - comunicaz
- Page 337 and 338:
comunicazioni libere - sessione A3
- Page 339 and 340:
comunicazioni libere - sessione B3
- Page 341 and 342:
comunicazioni libere - sessione B3
- Page 343 and 344:
comunicazioni libere - sessione B3
- Page 345:
comunicazioni libere - sessione B3
- Page 348 and 349:
8 settembre sessione B3 - comunicaz
- Page 350 and 351:
8 settembre sessione C3 - comunicaz
- Page 352 and 353:
8 settembre sessione C3 - comunicaz
- Page 354 and 355:
8 settembre sessione C3 - comunicaz
- Page 357 and 358:
comunicazioni libere - sessione C3
- Page 359 and 360:
comunicazioni libere - sessione C3
- Page 361 and 362:
poster 8 settembre IL CESAREO SU RI
- Page 363 and 364:
poster 8 settembre ANALISI DELLE PR
- Page 365 and 366:
poster 8 settembre PRESENTAZIONE DI
- Page 367 and 368:
poster 8 settembre IMPATTO DEGLI IN
- Page 369 and 370:
poster 8 settembre PORRE LIMITI ALL
- Page 371:
poster 8 settembre MORTALITA’ E D
- Page 374 and 375:
8 settembre poster punto) e per sot
- Page 376 and 377:
8 settembre poster diversi anelli i
- Page 378 and 379:
8 settembre poster Circa l’esposi
- Page 381 and 382:
poster 8 settembre L’UTILIZZO DI
- Page 383 and 384:
poster 8 settembre UN MODELLO PER L
- Page 385 and 386:
poster 8 settembre IL MONITORAGGIO
- Page 387 and 388:
poster 8 settembre INQUINAMENTO URB
- Page 389 and 390:
poster 8 settembre IL PARTO CESAREO
- Page 391 and 392:
poster 8 settembre LA VULNERABILIT
- Page 393 and 394:
poster 8 settembre VALUTAZIONE E MO
- Page 395 and 396:
poster 8 settembre PREVALENZA DI UT
- Page 397:
poster 8 settembre LA COMORBIDITÀ
- Page 400 and 401:
8 settembre poster Piemonte (esclus
- Page 402 and 403:
8 settembre poster ricovero per inf
- Page 404 and 405:
8 settembre poster L’analisi ha e
- Page 406 and 407:
8 settembre poster Conclusions Smok
- Page 408 and 409:
8 settembre poster L’analisi ha e
- Page 410 and 411:
8 settembre poster Conclusioni Il n
- Page 413 and 414:
poster 8 settembre PROFILO SOCIALE,
- Page 415:
poster 8 settembre ANALISI COSTO EF
- Page 418 and 419:
8 settembre poster 0 5 10 15 20 Ca-
- Page 420 and 421:
8 settembre poster esposizione del
- Page 422 and 423:
8 settembre poster Nella classe di
- Page 424 and 425:
8 settembre poster Per ogni dimensi
- Page 427 and 428:
poster 8 settembre RICERCA SU SOGGE
- Page 429 and 430:
poster 8 settembre STUDIO DI COORTE
- Page 431 and 432:
poster 8 settembre L’EPIDEMIOLOGI
- Page 433 and 434:
poster 8 settembre ANALISI VALUTATI
- Page 435 and 436:
poster 8 settembre INCIDENZA DI MES
- Page 437 and 438:
poster 8 settembre PROGETTO DI PREV
- Page 439:
poster 8 settembre PREVALENZA DI CA
- Page 442 and 443:
8 settembre poster Tenendo conto ch
- Page 445 and 446:
poster 9 settembre INFORTUNI SUL LA
- Page 447:
poster 9 settembre EPIDEMIOLOGIA DE
- Page 450 and 451:
9 settembre poster Inoltre, ancora
- Page 452 and 453:
9 settembre poster Molto interessan
- Page 454 and 455:
9 settembre poster - utilizzo nell
- Page 457 and 458:
poster 9 settembre LA MORTALITA’
- Page 459 and 460:
poster 9 settembre CONCENTRAZIONE D
- Page 461 and 462:
poster 9 settembre STIMA DELLA PREV
- Page 463:
poster 9 settembre GLI INCIDENTI DO
- Page 466 and 467:
9 settembre poster comorbilità deg
- Page 468 and 469:
9 settembre poster Discussione Lo s
- Page 470 and 471:
9 settembre poster che, nel 2000, i
- Page 472 and 473:
9 settembre poster Nei primi dieci
- Page 474 and 475:
9 settembre poster Conclusioni L’
- Page 476 and 477:
9 settembre poster principalmente d
- Page 478 and 479:
9 settembre poster Risultati Sono s
- Page 481 and 482:
poster 9 settembre PREVALENZA DI BP
- Page 483:
poster 9 settembre L’USO INTEGRAT
- Page 486 and 487:
9 settembre poster Riteniamo che le
- Page 488 and 489:
9 settembre poster utili sia per or
- Page 490 and 491:
9 settembre poster Conclusioni Se d
- Page 492 and 493:
9 settembre poster OBESITÀ E QUALI
- Page 494 and 495:
9 settembre poster - E’ in fase d
- Page 496 and 497:
9 settembre poster FERTILITÀ NEI F
- Page 498 and 499:
9 settembre poster Conclusioni L’
- Page 501 and 502:
poster 9 settembre PROGETTO DI VALU
- Page 503:
poster 9 settembre RISK FACTORS FOR
- Page 506 and 507:
9 settembre poster Conclusioni Dai
- Page 508 and 509:
9 settembre poster UTILIZZO DI VARI
- Page 510 and 511:
9 settembre poster Sono però neces
- Page 513 and 514:
poster 9 settembre TUMORI DELLA CUT
- Page 515 and 516:
poster 9 settembre INCIDENZA DI TUM
- Page 517 and 518:
poster 9 settembre CONOSCERE LA POP
- Page 519 and 520:
poster 9 settembre VALUTAZIONE DI I
- Page 521 and 522:
poster 9 settembre STILI DI VITA, A
- Page 523 and 524:
poster 9 settembre IL SUPERAMENTO D
- Page 525 and 526:
poster 9 settembre APPLICAZIONE DEL
- Page 527 and 528:
poster 9 settembre VALUTAZIONE DI E
- Page 529:
Documenti A.I.E.
- Page 532 and 533:
1. Le disuguaglianze di salute sul
- Page 534 and 535:
506 3. Particolarmente significativ
- Page 537 and 538:
Durante l’inverno appena concluso
- Page 539:
di 8.6 mesi di attesa di vita (rang
- Page 543:
PROFILI PROFESSIONALI e PERCORSI FO
- Page 546 and 547:
518 1. PREMESSA Il presente documen
- Page 548 and 549:
collocazione organizzativa di quest
- Page 551 and 552:
3. IL PROFILO DEL BIOSTATISTICO La
- Page 553:
4. LA FIGURA DELL’ASSISTENTE DI E
- Page 556 and 557:
Il quadro ora delineato non esauris
- Page 558 and 559:
530 allo stato attuale insufficient
- Page 560 and 561:
Disciplina / ruolo Igiene, Epidemio
- Page 562 and 563:
534 Allegato 3 PERCORSI PER LA FORM
- Page 565:
Si sono riunite a Torino il 28 genn
- Page 568 and 569:
La Segreteria può designare alcuni
- Page 570 and 571:
I costi delle attività delle sezio
- Page 572 and 573:
sessione B2 Epidemiologia degli inc
- Page 574 and 575:
Campi elettromagnetici (CEM) a 50HZ
- Page 576 and 577:
Prevalenza dell'infezione da epatit
- Page 579 and 580:
A Abeni D..........................
- Page 581 and 582:
Dolk H.............................
- Page 583 and 584:
Nonnato M..........................


