- Page 1 and 2:
INTERNATIONAL ENERGY AGENCY WORLD E
- Page 3 and 4:
INTERNATIONAL ENERGY AGENCY WORLD E
- Page 5 and 6:
FOREWORD World leaders have pledged
- Page 7 and 8:
ACKNOWLEDGEMENTS This study was pre
- Page 9 and 10:
Helen Dickinson Carmen Difiglio Sim
- Page 11 and 12:
Tarhan Feyzioğlu John Fu Hu Gao We
- Page 13 and 14:
Comments and questions are welcome
- Page 15 and 16:
GLOBAL ENERGY TRENDS ENERGY TRENDS
- Page 17 and 18:
Explaining China’s and India’s
- Page 19 and 20:
Oil Resources and Reserves 318 Oil
- Page 21 and 22:
16 17 Reference Scenario Demand Pro
- Page 23 and 24:
List of Figures Introduction 1. Sha
- Page 25 and 26:
3.9 Share of Energy in World Intern
- Page 27 and 28:
9.7 International Comparison of Fle
- Page 29 and 30:
13.5 Contribution of the Coastal Re
- Page 31 and 32:
18.4 India’s CO 2 Emissions in th
- Page 33 and 34:
2.2 Sectoral Shares in Final Energy
- Page 35 and 36:
11.6 Key Policy Assumptions in Chin
- Page 37 and 38:
List of Boxes Introduction 1. Model
- Page 39 and 40:
16.5 Kerosene Use in Rural Areas of
- Page 41:
World Energy Outlook Series World E
- Page 44 and 45:
above current levels in 2030. To ac
- Page 46 and 47:
Reference Scenario. In the High Gro
- Page 48 and 49:
Reference Scenario, primary energy
- Page 50 and 51:
By contrast, faster implementation
- Page 52 and 53:
of this increase. China is by far t
- Page 54 and 55:
There are large potential gains to
- Page 56 and 57:
India are now so big that they are
- Page 58 and 59:
of the two giants in international
- Page 60 and 61:
second trading period (2008-2012) o
- Page 62 and 63:
Table 1: World Population Growth (a
- Page 64 and 65:
high (see below). In the longer ter
- Page 66 and 67:
Table 3: Fossil-Fuel Price Assumpti
- Page 68 and 69:
$41 per tonne to $63 in 2006 (in ye
- Page 70 and 71:
In line with last year’s Outlook,
- Page 72 and 73:
equilibrium for international trade
- Page 75 and 76:
CHAPTER 1 GLOBAL ENERGY TRENDS
- Page 77 and 78:
standards for vehicles and new meas
- Page 79 and 80:
Figure 1.2: Increase in World Prima
- Page 81 and 82:
Global primary energy intensity, me
- Page 83 and 84:
Figure 1.6: Share of Transport in P
- Page 85 and 86:
Russia, Central Asia, Latin America
- Page 87 and 88:
It is certainly possible that decli
- Page 89 and 90:
Table 1.5: World Primary Natural Ga
- Page 91 and 92:
developments in clean coal technolo
- Page 93 and 94:
in the form of coking coal, grow st
- Page 95 and 96:
(Table 1.8). India and China experi
- Page 97 and 98:
Table 1.9: Cumulative Investment in
- Page 99 and 100:
policy implementation is critical:
- Page 101 and 102:
transition economies, because there
- Page 103 and 104:
15.1% in 2030, compared with 11.7%
- Page 105 and 106:
Table 1.12: World Primary Natural G
- Page 107 and 108:
Figure 1.19: Incremental Non-Fossil
- Page 109 and 110:
Figure 1.20: Fuel Mix in World Powe
- Page 111 and 112:
Table 1.14: World Primary Energy De
- Page 113 and 114:
The regional effect on oil imports
- Page 115 and 116:
in the Reference Scenario to 1 481
- Page 117:
The High Growth Scenario projection
- Page 120 and 121:
Reference Scenario Energy Demand Th
- Page 122 and 123:
having rebounded in the early part
- Page 124 and 125:
80% Figure 2.3: Fuel Mix in Power G
- Page 126 and 127:
SPOTLIGHT Are China and India Follo
- Page 128 and 129:
For both China and India, the story
- Page 130 and 131:
imports are projected to rise furth
- Page 132 and 133:
equires $956 billion of capital spe
- Page 134 and 135:
Table 2.4: Primary Energy Demand in
- Page 136 and 137:
Figure 2.9: Primary Energy Demand i
- Page 138 and 139:
China and India in the Global Econo
- Page 140 and 141:
production and exports of manufactu
- Page 142 and 143:
International Trade and Financial F
- Page 144 and 145:
total coal use in 2005, and the sec
- Page 146 and 147:
total stock of Chinese ODI amounted
- Page 148 and 149:
fear that Chinese and Indian export
- Page 150 and 151:
SPOTLIGHT (continued) In general, e
- Page 152 and 153:
Box 3.2: Modelling Economic and Ene
- Page 154 and 155:
Table 3.2: Fossil-Fuel Prices in th
- Page 156 and 157:
etween 5% and 8% in the High Growth
- Page 158 and 159:
Table 3.3: World Real GDP Growth in
- Page 160 and 161:
The results presented here should b
- Page 162 and 163:
Energy Security in a Global Market
- Page 164 and 165:
■ Adequate investment in producti
- Page 166 and 167:
efined products are global commodit
- Page 168 and 169:
Figure 4.1: Share of China and Indi
- Page 170 and 171:
Figure 4.3: Share of China and Indi
- Page 172 and 173:
Figure 4.4: Oil Export Flows from t
- Page 174 and 175:
Table 4.3: Net Natural Gas Imports
- Page 176 and 177: Coal Coal dominates energy use in C
- Page 178 and 179: Energy savings Diversification of f
- Page 180 and 181: In China, oil security has emerged
- Page 182 and 183: deprive the companies of profits an
- Page 184 and 185: western markets. Any disruption to
- Page 186 and 187: 2015 and 20% higher in 2030. The ri
- Page 188 and 189: Figure 4.10: Major World Oil Supply
- Page 190 and 191: imports is demonstrated by the Alte
- Page 192 and 193: prices to all consuming countries m
- Page 194 and 195: Energy-Related CO 2 Emissions Globa
- Page 196 and 197: In the past two-and-a-half decades,
- Page 198 and 199: Transport contributes roughly a fif
- Page 200 and 201: Box 5.1: Regional Air Quality (Cont
- Page 202 and 203: Box 5.2: Which Countries Emit the M
- Page 204 and 205: egion (Table 5.3 and Figure 5.10).
- Page 206 and 207: Figure 5.11: Change in Carbon Inten
- Page 208 and 209: Table 5.4: CO 2 Concentrations and
- Page 210 and 211: illustrate the magnitude and urgenc
- Page 212 and 213: Energy Demand by Sector CO 2 emissi
- Page 214 and 215: Figure 5.13: Electricity Generation
- Page 216 and 217: The capital costs involved in stabi
- Page 218 and 219: Focus on Prospects for Clean Coal T
- Page 220 and 221: Technologies involving the absorpti
- Page 222 and 223: There are a number of barriers to t
- Page 224 and 225: scheduled to operate in the first h
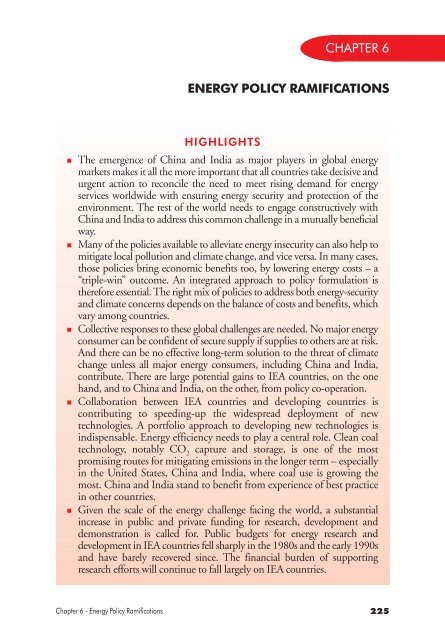
- Page 228 and 229: Addressing Energy Security and Clim
- Page 230 and 231: The right mix of policies to addres
- Page 232 and 233: considerable amount of work on iden
- Page 234 and 235: Box 6.1: Co-operative Activities Be
- Page 236 and 237: Box 6.2: Bilateral Co-operation bet
- Page 238 and 239: Figure 6.1: Public Energy Research
- Page 240 and 241: Several international collaborative
- Page 242 and 243: Table 6.1: Status of CDM Projects i
- Page 245 and 246: CHAPTER 7 POLITICAL, ECONOMIC A
- Page 247 and 248: central government and the CPC reta
- Page 249 and 250: isen by more than 20% annually over
- Page 251 and 252: investing in China have combined wo
- Page 253 and 254: Economic Challenges and Prospects A
- Page 255 and 256: SPOTLIGHT Will Government Efforts t
- Page 257 and 258: expansion of rural health insurance
- Page 259 and 260: Urbanisation China has undergone ra
- Page 261: 74 for women - levels seen in middl
- Page 264 and 265: China’s Energy Sector In less tha
- Page 266 and 267: Power generation currently accounts
- Page 268 and 269: Figure 8.2: Per-Capita Primary Ener
- Page 270 and 271: The oil and gas industry and the po
- Page 272 and 273: A variety of other government agenc
- Page 274 and 275: way that is more equitable, more en
- Page 276 and 277:
urning of fossil fuels, the loss of
- Page 278 and 279:
Table 8.2: Selected Targets for Imp
- Page 280 and 281:
In August 2006, the State Council i
- Page 282 and 283:
to bring domestic oil prices closer
- Page 284 and 285:
Yet there may be some transferable
- Page 286 and 287:
Key Assumptions The energy projecti
- Page 288 and 289:
Table 9.2: Energy Intensity in Sele
- Page 290 and 291:
Coal remains the dominant fuel in C
- Page 292 and 293:
In absolute terms, industry is the
- Page 294 and 295:
chemicals and petrochemicals, and n
- Page 296 and 297:
Iron and Steel The iron and steel s
- Page 298 and 299:
China is the world’s largest prod
- Page 300 and 301:
Road Road energy use increases more
- Page 302 and 303:
million Figure 9.6: New Car Sales i
- Page 304 and 305:
Table 9.7: Vehicle Ownership by Pro
- Page 306 and 307:
Other Modes In 2005, aviation, navi
- Page 308 and 309:
Box 9.4: Natural Gas Use in Towns a
- Page 310 and 311:
Appliances Stock and Efficiency Fou
- Page 312 and 313:
Environmental Implications Local Ai
- Page 314 and 315:
Box 9.5: Household Use of Biomass a
- Page 316 and 317:
energy efficiency improves. However
- Page 318 and 319:
Figure 9.12: China CDM CO 2 Reducti
- Page 320 and 321:
Oil Supply Oil Resources and Reserv
- Page 322 and 323:
Oil Production 3 Oil production in
- Page 324 and 325:
Box 10.1: Restructuring of China’
- Page 326 and 327:
will achieve this, as capacity outs
- Page 328 and 329:
In the Reference Scenario, net oil
- Page 330 and 331:
For example, the current value of C
- Page 332 and 333:
Figure 10.7: Natural Gas Discoverie
- Page 334 and 335:
Gas Imports China imported gas - as
- Page 336 and 337:
In the Reference Scenario, the Turk
- Page 338 and 339:
and sulphur levels can vary enormou
- Page 340 and 341:
Box 10.3: Coal Mining Safety in Chi
- Page 342 and 343:
network at roughly double the natio
- Page 344 and 345:
indigenous coal supply costs are ex
- Page 346 and 347:
The establishment of the State Elec
- Page 348 and 349:
China added 18 GW of supercritical
- Page 350 and 351:
Box 10.4: Carbon Capture and Storag
- Page 352 and 353:
Most of the new generating capacity
- Page 354 and 355:
South East Central North West Figur
- Page 356 and 357:
eturn to foreign investors on wind
- Page 358 and 359:
phase of a wind project must be mad
- Page 360 and 361:
will be essential. The Agricultural
- Page 363 and 364:
CHAPTER 11 ALTERNATIVE POLICY SCENA
- Page 365 and 366:
uncertainty stems from how policies
- Page 367 and 368:
Figure 11.1: China’s Primary Ener
- Page 369 and 370:
dependence. CTL production reaches
- Page 371 and 372:
emissions began to rise again in 20
- Page 373 and 374:
Box 11.1: Impact of Climate Change
- Page 375 and 376:
Summary of Results The projected el
- Page 377 and 378:
Table 11.4: Key Policy Assumptions
- Page 379 and 380:
Table 11.5: China’s Industrial En
- Page 381 and 382:
Table 11.6: Key Policy Assumptions
- Page 383 and 384:
Figure 11.8: Savings in China’s T
- Page 385 and 386:
to levels in the United States. Chi
- Page 387 and 388:
implemented in the scenario mean th
- Page 389 and 390:
pay for themselves, as savings in f
- Page 391 and 392:
CHAPTER 12 HIGH GROWTH SCENARIO PRO
- Page 393 and 394:
economy to foreign investment. Chin
- Page 395 and 396:
Demand for non-fossil energy source
- Page 397 and 398:
Implications for Energy Markets and
- Page 399 and 400:
Table 12.2: Incremental Oil Product
- Page 401 and 402:
Implications for Investment To meet
- Page 403 and 404:
In the High Growth Scenario, NO x e
- Page 405 and 406:
CHAPTER 13 FOCUS ON THE COASTAL REG
- Page 407 and 408:
Figure 13.1: Provinces and Regions
- Page 409 and 410:
and technology. One basic assumptio
- Page 411 and 412:
Table 13.3: Primary Energy Demand i
- Page 413 and 414:
the coast are crucial because they
- Page 415 and 416:
Table 13.4: Electricity Generation
- Page 417 and 418:
Figure 13.7: Car Ownership and GDP
- Page 419 and 420:
esources, 19% of oil and 11% of nat
- Page 421 and 422:
12 Figure 13.10: CO 2 Emissions per
- Page 423:
CO 2 emissions (Mt) Shares (%) Grow
- Page 427 and 428:
CHAPTER 14 POLITICAL, ECONOMIC AND
- Page 429 and 430:
In total, India has 23 official lan
- Page 431 and 432:
Figure 14.1: GDP per Capita by Stat
- Page 433 and 434:
In India, labour productivity, meas
- Page 435 and 436:
SPOTLIGHT Will Economic Growth Solv
- Page 437 and 438:
$103 billion in 2005. The share in
- Page 439 and 440:
of growth in energy demand. How the
- Page 441 and 442:
50% Figure 14.6: Share of Gross Cap
- Page 443:
This will depend on having sufficie
- Page 446 and 447:
India's Energy Sector India, the sl
- Page 448 and 449:
Figure 15.1: India's Fossil Fuel Pr
- Page 450 and 451:
SPOTLIGHT Why Does the Government N
- Page 452 and 453:
Unreliable power damages business a
- Page 454 and 455:
■ urban, industrial and commercia
- Page 456 and 457:
These reforms have achieved their o
- Page 458 and 459:
Table 15.3: India's Integrated Ener
- Page 460 and 461:
Energy Policy Challenges While ackn
- Page 462 and 463:
to 2006. More efficient vehicles co
- Page 464 and 465:
than one-and-a-half times the India
- Page 466 and 467:
Key Assumptions The Reference Scena
- Page 468 and 469:
in 2030. Natural gas is the fastest
- Page 470 and 471:
Coal accounts for 41% of industrial
- Page 472 and 473:
ased DRI plants are at various stag
- Page 474 and 475:
Infrastructure construction is driv
- Page 476 and 477:
in 2030. Strong vehicle growth will
- Page 478 and 479:
Table 16.3: Four-Wheel Vehicle Emis
- Page 480 and 481:
75% of India’s residential demand
- Page 482 and 483:
Residential consumption of natural
- Page 484 and 485:
access to electricity between rural
- Page 486 and 487:
Box 16.6: Energy and Water Use in t
- Page 488 and 489:
emissions come from burning coal, m
- Page 491 and 492:
CHAPTER 17 REFERENCE SCENARIO SUPPL
- Page 493 and 494:
Figure 17.1: Oil Discoveries in Ind
- Page 495 and 496:
Our oil-production projections are
- Page 497 and 498:
maintaining export capacity beyond
- Page 499 and 500:
Box 17.1: India's Emergency Oil Sto
- Page 501 and 502:
In the last ten years, 90 non-assoc
- Page 503 and 504:
last seven years in the Krishna-God
- Page 505 and 506:
following decade. But major new cap
- Page 507 and 508:
Figure 17.8: Major Coal Fields and
- Page 509 and 510:
Box 17.2: Coal Mining Productivity
- Page 511 and 512:
southern coasts. At the high coal p
- Page 513 and 514:
owned by the central government. Th
- Page 515 and 516:
Box 17.3: Coal-Fired Power Plant Te
- Page 517 and 518:
Oil plays a minor role in electrici
- Page 519 and 520:
projected to amount to 410 GW, incl
- Page 521 and 522:
India started using ethanol recentl
- Page 523 and 524:
Oil and Gas The Reference Scenario
- Page 525 and 526:
could increase by nearly a third be
- Page 527 and 528:
(mainly related to tariff policy),
- Page 529 and 530:
in 1991 - right when the market ope
- Page 531:
implementation delays and escalatin
- Page 534 and 535:
Background and Assumptions Like Chi
- Page 536 and 537:
coal savings. Coal demand grows muc
- Page 538 and 539:
nuclear power; lower electricity de
- Page 540 and 541:
Figure 18.4: India’s CO 2 Emissio
- Page 542 and 543:
Results by Sector Power Generation
- Page 544 and 545:
■ ■ The efficiency of the power
- Page 546 and 547:
Gas-fired power generation accounts
- Page 548 and 549:
Table 18.3: Key Policies in India's
- Page 550 and 551:
Transport Policy Assumptions and Ef
- Page 552 and 553:
Scenario by 28% more in 2030 than i
- Page 554 and 555:
energy demand over the Outlook peri
- Page 556 and 557:
Figure 18.10: Reduction in Final En
- Page 558 and 559:
Figure 18.13: Payback Periods for V
- Page 561 and 562:
CHAPTER 19 HIGH GROWTH SCENARIO PRO
- Page 563 and 564:
Scenario and, in 2015-2030, 1.7 per
- Page 565 and 566:
Biomass is the only fuel for which
- Page 567 and 568:
economy boosts output in manufactur
- Page 569 and 570:
Despite higher oil recovery rates,
- Page 571 and 572:
Total oil investment is projected t
- Page 573 and 574:
In the High Growth Scenario all hou
- Page 575 and 576:
CHAPTER 20 FOCUS ON ENERGY POVERTY
- Page 577 and 578:
Table 20.1: Number of People in Ind
- Page 579 and 580:
Figure 20.1: Electricity Access and
- Page 581 and 582:
Table 20.2: Energy Development Inde
- Page 583 and 584:
Table 20.3: Costs of Electrifying H
- Page 585 and 586:
Blindness is also more prevalent am
- Page 587 and 588:
Box 20.3: Deepam LPG Scheme in Andh
- Page 589:
Table 20.4: Cities with More than O
- Page 593 and 594:
ANNEX A TABLES FOR REFERENCE AND AL
- Page 595 and 596:
Reference Scenario: World Electrici
- Page 597 and 598:
Alternative Policy Scenario: World
- Page 599 and 600:
Reference Scenario: China Electrici
- Page 601 and 602:
Alternative Policy Scenario: China
- Page 603 and 604:
Reference Scenario: India Electrici
- Page 605 and 606:
Alternative Policy Scenario: India
- Page 607 and 608:
Alternative Policy Scenario: OECD E
- Page 609 and 610:
Alternative Policy Scenario: OECD N
- Page 611 and 612:
Alternative Policy Scenario: United
- Page 613 and 614:
Alternative Policy Scenario: OECD P
- Page 615 and 616:
Alternative Policy Scenario: Japan
- Page 617 and 618:
Alternative Policy Scenario: OECD E
- Page 619 and 620:
Alternative Policy Scenario: Europe
- Page 621 and 622:
Alternative Policy Scenario: Transi
- Page 623 and 624:
Alternative Policy Scenario: Russia
- Page 625 and 626:
Alternative Policy Scenario: Develo
- Page 627 and 628:
Alternative Policy Scenario: Develo
- Page 629 and 630:
Alternative Policy Scenario: Latin
- Page 631 and 632:
Alternative Policy Scenario: Middle
- Page 633:
Alternative Policy Scenario: Africa
- Page 636 and 637:
Oil and Gas boe barrels of oil equi
- Page 638 and 639:
Heavy Petroleum Products Heavy petr
- Page 640 and 641:
Observed Decline Rate The productio
- Page 642 and 643:
European Union Austria, Belgium, Bu
- Page 645 and 646:
ANNEX C ACRONYMS APS CAFE CBM CCGT
- Page 647:
UNDP UNEP UNFCCC USGS WEM WHO WTI W
- Page 650 and 651:
Chapter 3: International Trade and
- Page 652 and 653:
Chapter 5: Global Environmental Rep
- Page 654 and 655:
United Nations Statistics Division
- Page 656 and 657:
United Nations Environment Programm
- Page 658 and 659:
Pan, K. (2005), “The Depth Distri
- Page 660 and 661:
World Bank (2007), Doing Business i
- Page 662 and 663:
Chapter 17: Reference Scenario Supp
- Page 664 and 665:
Pucher, J., N. Korattyswaropam, N.
- Page 667:
The Online Bookshop International E