- Page 1 and 2:
INTERNATIONAL ENERGY AGENCY WORLD E
- Page 3 and 4:
INTERNATIONAL ENERGY AGENCY WORLD E
- Page 5 and 6:
FOREWORD World leaders have pledged
- Page 7 and 8:
ACKNOWLEDGEMENTS This study was pre
- Page 9 and 10:
Helen Dickinson Carmen Difiglio Sim
- Page 11 and 12:
Tarhan Feyzioğlu John Fu Hu Gao We
- Page 13 and 14:
Comments and questions are welcome
- Page 15 and 16:
GLOBAL ENERGY TRENDS ENERGY TRENDS
- Page 17 and 18:
Explaining China’s and India’s
- Page 19 and 20:
Oil Resources and Reserves 318 Oil
- Page 21 and 22:
16 17 Reference Scenario Demand Pro
- Page 23 and 24:
List of Figures Introduction 1. Sha
- Page 25 and 26:
3.9 Share of Energy in World Intern
- Page 27 and 28:
9.7 International Comparison of Fle
- Page 29 and 30:
13.5 Contribution of the Coastal Re
- Page 31 and 32:
18.4 India’s CO 2 Emissions in th
- Page 33 and 34:
2.2 Sectoral Shares in Final Energy
- Page 35 and 36:
11.6 Key Policy Assumptions in Chin
- Page 37 and 38:
List of Boxes Introduction 1. Model
- Page 39 and 40:
16.5 Kerosene Use in Rural Areas of
- Page 41:
World Energy Outlook Series World E
- Page 44 and 45:
above current levels in 2030. To ac
- Page 46 and 47:
Reference Scenario. In the High Gro
- Page 48 and 49:
Reference Scenario, primary energy
- Page 50 and 51:
By contrast, faster implementation
- Page 52 and 53:
of this increase. China is by far t
- Page 54 and 55:
There are large potential gains to
- Page 56 and 57:
India are now so big that they are
- Page 58 and 59:
of the two giants in international
- Page 60 and 61:
second trading period (2008-2012) o
- Page 62 and 63:
Table 1: World Population Growth (a
- Page 64 and 65:
high (see below). In the longer ter
- Page 66 and 67:
Table 3: Fossil-Fuel Price Assumpti
- Page 68 and 69:
$41 per tonne to $63 in 2006 (in ye
- Page 70 and 71:
In line with last year’s Outlook,
- Page 72 and 73:
equilibrium for international trade
- Page 75 and 76:
CHAPTER 1 GLOBAL ENERGY TRENDS
- Page 77 and 78:
standards for vehicles and new meas
- Page 79 and 80:
Figure 1.2: Increase in World Prima
- Page 81 and 82:
Global primary energy intensity, me
- Page 83 and 84:
Figure 1.6: Share of Transport in P
- Page 85 and 86:
Russia, Central Asia, Latin America
- Page 87 and 88:
It is certainly possible that decli
- Page 89 and 90:
Table 1.5: World Primary Natural Ga
- Page 91 and 92:
developments in clean coal technolo
- Page 93 and 94:
in the form of coking coal, grow st
- Page 95 and 96:
(Table 1.8). India and China experi
- Page 97 and 98:
Table 1.9: Cumulative Investment in
- Page 99 and 100:
policy implementation is critical:
- Page 101 and 102:
transition economies, because there
- Page 103 and 104:
15.1% in 2030, compared with 11.7%
- Page 105 and 106:
Table 1.12: World Primary Natural G
- Page 107 and 108:
Figure 1.19: Incremental Non-Fossil
- Page 109 and 110:
Figure 1.20: Fuel Mix in World Powe
- Page 111 and 112:
Table 1.14: World Primary Energy De
- Page 113 and 114:
The regional effect on oil imports
- Page 115 and 116:
in the Reference Scenario to 1 481
- Page 117:
The High Growth Scenario projection
- Page 120 and 121:
Reference Scenario Energy Demand Th
- Page 122 and 123:
having rebounded in the early part
- Page 124 and 125:
80% Figure 2.3: Fuel Mix in Power G
- Page 126 and 127:
SPOTLIGHT Are China and India Follo
- Page 128 and 129:
For both China and India, the story
- Page 130 and 131:
imports are projected to rise furth
- Page 132 and 133:
equires $956 billion of capital spe
- Page 134 and 135:
Table 2.4: Primary Energy Demand in
- Page 136 and 137:
Figure 2.9: Primary Energy Demand i
- Page 138 and 139:
China and India in the Global Econo
- Page 140 and 141:
production and exports of manufactu
- Page 142 and 143:
International Trade and Financial F
- Page 144 and 145:
total coal use in 2005, and the sec
- Page 146 and 147:
total stock of Chinese ODI amounted
- Page 148 and 149:
fear that Chinese and Indian export
- Page 150 and 151:
SPOTLIGHT (continued) In general, e
- Page 152 and 153:
Box 3.2: Modelling Economic and Ene
- Page 154 and 155:
Table 3.2: Fossil-Fuel Prices in th
- Page 156 and 157:
etween 5% and 8% in the High Growth
- Page 158 and 159:
Table 3.3: World Real GDP Growth in
- Page 160 and 161:
The results presented here should b
- Page 162 and 163:
Energy Security in a Global Market
- Page 164 and 165:
■ Adequate investment in producti
- Page 166 and 167:
efined products are global commodit
- Page 168 and 169:
Figure 4.1: Share of China and Indi
- Page 170 and 171:
Figure 4.3: Share of China and Indi
- Page 172 and 173:
Figure 4.4: Oil Export Flows from t
- Page 174 and 175:
Table 4.3: Net Natural Gas Imports
- Page 176 and 177:
Coal Coal dominates energy use in C
- Page 178 and 179:
Energy savings Diversification of f
- Page 180 and 181:
In China, oil security has emerged
- Page 182 and 183:
deprive the companies of profits an
- Page 184 and 185:
western markets. Any disruption to
- Page 186 and 187:
2015 and 20% higher in 2030. The ri
- Page 188 and 189:
Figure 4.10: Major World Oil Supply
- Page 190 and 191:
imports is demonstrated by the Alte
- Page 192 and 193:
prices to all consuming countries m
- Page 194 and 195:
Energy-Related CO 2 Emissions Globa
- Page 196 and 197:
In the past two-and-a-half decades,
- Page 198 and 199:
Transport contributes roughly a fif
- Page 200 and 201:
Box 5.1: Regional Air Quality (Cont
- Page 202 and 203:
Box 5.2: Which Countries Emit the M
- Page 204 and 205:
egion (Table 5.3 and Figure 5.10).
- Page 206 and 207:
Figure 5.11: Change in Carbon Inten
- Page 208 and 209:
Table 5.4: CO 2 Concentrations and
- Page 210 and 211:
illustrate the magnitude and urgenc
- Page 212 and 213:
Energy Demand by Sector CO 2 emissi
- Page 214 and 215:
Figure 5.13: Electricity Generation
- Page 216 and 217:
The capital costs involved in stabi
- Page 218 and 219:
Focus on Prospects for Clean Coal T
- Page 220 and 221:
Technologies involving the absorpti
- Page 222 and 223:
There are a number of barriers to t
- Page 224 and 225:
scheduled to operate in the first h
- Page 227 and 228:
CHAPTER 6 ENERGY POLICY RAMIFICATIO
- Page 229 and 230:
■ Conserving energy: Conservation
- Page 231 and 232:
The results of our Alternative Poli
- Page 233 and 234:
increasing need for oil and gas. Th
- Page 235 and 236:
Co-operation is a two-way street; I
- Page 237 and 238:
Technology Co-operation and Collabo
- Page 239 and 240:
continue to make an important contr
- Page 241 and 242:
een registered, are being validated
- Page 243:
PART B CHINA’S ENERGY PROSPECTS
- Page 246 and 247:
The Political Context 1 Established
- Page 248 and 249:
percentage points over 2001. 3 In 2
- Page 250 and 251:
education. However, the government
- Page 252 and 253:
Capital accumulation was boosted by
- Page 254 and 255:
several times since the beginning o
- Page 256 and 257:
Yet pockets of extreme poverty rema
- Page 258 and 259:
year over the projection period, re
- Page 260 and 261:
infrastructure, housing and service
- Page 263 and 264:
CHAPTER 8 OVERVIEW OF THE ENERGY SE
- Page 265 and 266:
In the 1980s and 1990s, energy dema
- Page 267 and 268:
Industry has long been the largest
- Page 269 and 270:
Figure 8.3: China’s Energy Produc
- Page 271 and 272:
Figure 8.4: Organisation of Energy
- Page 273 and 274:
Box 8.2: Energy Goals in China’s
- Page 275 and 276:
Box 8.3: Coal-Based Alternative Fue
- Page 277 and 278:
projects are still the largest alte
- Page 279 and 280:
of these businesses. In its early s
- Page 281 and 282:
and retail competition, but much wo
- Page 283 and 284:
Access to Modern Energy China has a
- Page 285 and 286:
CHAPTER 9 REFERENCE SCENARIO DEMAND
- Page 287 and 288:
growth (Table 9.1). It is possible
- Page 289 and 290:
Table 9.3: China’s Primary Energy
- Page 291 and 292:
with an 89% share in 2005. By 2030,
- Page 293 and 294:
exported goods was only 197 Mtoe, o
- Page 295 and 296:
energy intensity of 9% in steel pro
- Page 297 and 298:
Non-Metallic Minerals The non-metal
- Page 299 and 300:
to 7.0% in 2005-2015 and 4.4% in 20
- Page 301 and 302:
Box 9.2: Prospects for Alternative
- Page 303 and 304:
develop their own-brand vehicles in
- Page 305 and 306:
standards are most stringent for he
- Page 307 and 308:
nearly one-fifth of the increase in
- Page 309 and 310:
in cities is assumed to grow steadi
- Page 311 and 312:
Appliance efficiency improvements w
- Page 313 and 314:
FGD units installed, along with the
- Page 315 and 316:
Table 9.8: Emissions of Major Pollu
- Page 317 and 318:
generate almost 1.2 billion CERs by
- Page 319 and 320:
CHAPTER 10 REFERENCE SCENARIO SUPPL
- Page 321 and 322:
Figure 10.1: China’s Oil and Gas
- Page 323 and 324:
Table 10.2: China’s Oil Productio
- Page 325 and 326:
Oil Refining China’s refining cap
- Page 327 and 328:
Saudi Aramco taking combined stakes
- Page 329 and 330:
Box 10.2: China’s Emergency Oil S
- Page 331 and 332:
which close to 90% are onshore (Tab
- Page 333 and 334:
Table 10.5: China’s Natural Gas P
- Page 335 and 336:
e built, because of concerns about
- Page 337 and 338:
coal resources lie in the provinces
- Page 339 and 340:
Table 10.7: China’s Coal Producti
- Page 341 and 342:
of 829 Mt of coal each year by the
- Page 343 and 344:
An outside-plan spot market has exi
- Page 345 and 346:
Figure 10.13: China’s Hard Coal T
- Page 347 and 348:
Figure 10.14: Electricity Generatio
- Page 349 and 350:
China is pursuing a dual objective
- Page 351 and 352:
Capacity Requirements In the past t
- Page 353 and 354:
to consumers approximately 70% of a
- Page 355 and 356:
8 Figure 10.17: Plant Generating Co
- Page 357 and 358:
undertaken because of its economic
- Page 359 and 360:
China designated biofuels as a prio
- Page 361:
could help China achieve its object
- Page 364 and 365:
Background and Assumptions China’
- Page 366 and 367:
and consumption technologies. By 20
- Page 368 and 369:
Reference Scenario. More than two-t
- Page 370 and 371:
The most striking difference concer
- Page 372 and 373:
The slow-down in the growth of CO 2
- Page 374 and 375:
power generation and improving the
- Page 376 and 377:
of nuclear power reaches 6% of tota
- Page 378 and 379:
educing industrial consumption, eit
- Page 380 and 381:
towards gas-based ammonia productio
- Page 382 and 383:
Summary of Results In the Alternati
- Page 384 and 385:
Table 11.8: Policy Assumptions in C
- Page 386 and 387:
improve and appliance ownership inc
- Page 388 and 389:
Box 11.2: Cost-Effectiveness of Imp
- Page 390 and 391:
Investment in fossil-fuel supply is
- Page 392 and 393:
On the other hand, higher economic
- Page 394 and 395:
two-thirds of incremental oil deman
- Page 396 and 397:
Of the main final sectors, the tran
- Page 398 and 399:
Higher international prices also bo
- Page 400 and 401:
128 bcm to 216 bcm in 2030. In orde
- Page 402 and 403:
generation reaches 7.4 MWh, close t
- Page 404 and 405:
Though higher economic growth would
- Page 406 and 407:
The magnitude of the region’s imp
- Page 408 and 409:
Table 13.1: Economic Indicators by
- Page 410 and 411:
Figure 13.2: Share of the Coastal R
- Page 412 and 413:
Figure 13.3: Provincial Energy Inte
- Page 414 and 415:
incremental final energy demand. Fo
- Page 416 and 417:
Industry Industry is today the main
- Page 418 and 419:
the population in Beijing having ac
- Page 420 and 421:
The coastal provinces, with a deman
- Page 422 and 423:
APPENDIX TO CHAPTER 13: CHINA COAST
- Page 425:
PART C INDIA’S ENERGY PROSPECTS
- Page 428 and 429:
The Political Context India is a fe
- Page 430 and 431:
up from 9% in 2005 and 8.3% in 2004
- Page 432 and 433:
Assam are on average poorer than ma
- Page 434 and 435:
in manufacturing productivity was t
- Page 436 and 437:
Economic Challenges Continuation of
- Page 438 and 439:
South Asia is the least integrated
- Page 440 and 441:
Box 14.2: Special Economic Zones in
- Page 442 and 443:
ecently extended into petrochemical
- Page 445 and 446:
CHAPTER 15 OVERVIEW OF THE ENERGY S
- Page 447 and 448:
after China and the United States.
- Page 449 and 450:
Box 15.1: India's Energy Statistics
- Page 451 and 452:
which was created in 1984 to reduce
- Page 453 and 454:
■ Electricity Regulatory Commissi
- Page 455 and 456:
and production, and in liquefied na
- Page 457 and 458:
(because of the captive restriction
- Page 459 and 460:
Table 15.3: India's Integrated Ener
- Page 461 and 462:
of Finance's Economic Survey 2006-2
- Page 463 and 464:
Box 15.3: Public-Private Partnershi
- Page 465 and 466:
CHAPTER 16 REFERENCE SCENARIO DEMAN
- Page 467 and 468:
Most energy prices in India are con
- Page 469 and 470:
Energy demand in the residential se
- Page 471 and 472:
Iron and Steel Industry India’s i
- Page 473 and 474:
80%. Past subsidies eliminated ince
- Page 475 and 476:
The transport sector currently cons
- Page 477 and 478:
Box 16.3: Upside Potential of Trans
- Page 479 and 480:
Figure 16.6: Residential Fuel Mix i
- Page 481 and 482:
Biomass use in urban households 14
- Page 483 and 484: Kerosene and LPG supply 83% of the
- Page 485 and 486: Other Sectors The services sector a
- Page 487 and 488: from other sources - mainly industr
- Page 489: Despite improvements in thermal eff
- Page 492 and 493: Oil Supply Resources and Reserves I
- Page 494 and 495: and decline to just under 400 kb/d
- Page 496 and 497: expansions of cracking units. Betwe
- Page 498 and 499: For crude oil alone, India's import
- Page 500 and 501: Figure 17.5: Main Oil and Gas Infra
- Page 502 and 503: come from offshore non-associated g
- Page 504 and 505: Figure 17.7: India's Natural Gas Ba
- Page 506 and 507: 98 billion tonnes, principally in J
- Page 508 and 509: Table 17.8: Coal Production in Indi
- Page 510 and 511: 15 000 Figure 17.9: Coal-Mining Pro
- Page 512 and 513: Figure 17.10: India's Coal Producti
- Page 514 and 515: India's coal-fired power plants are
- Page 516 and 517: Box 17.4: CO 2 Capture and Storage
- Page 518 and 519: Box 17.5: India's Nuclear Power Gen
- Page 520 and 521: 8 Figure 17.13: Electricity Generat
- Page 522 and 523: India receives abundant solar radia
- Page 524 and 525: in power generation alone is estima
- Page 526 and 527: In 2005, revenues from electricity
- Page 528 and 529: Figure 17.17: Electricity Losses by
- Page 530 and 531: were shut down. Despite past proble
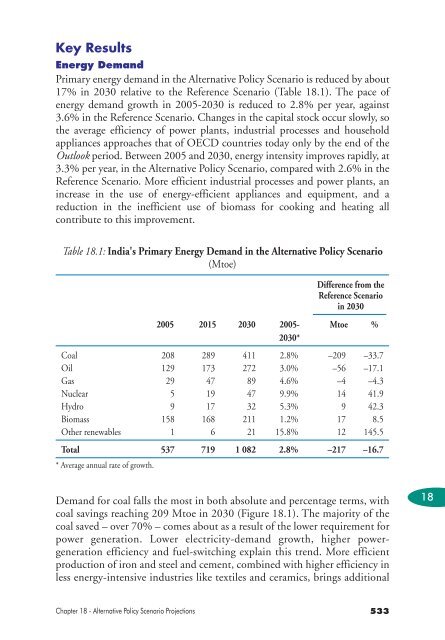
- Page 533: CHAPTER 18 ALTERNATIVE POLICY SCENA
- Page 537 and 538: energy demand in the Alternative Po
- Page 539 and 540: 18 Figure 18.3: Local Air Pollutant
- Page 541 and 542: Box 18.1: The Impacts of Climate Ch
- Page 543 and 544: Summary of Results Total electricit
- Page 545 and 546: Box 18.2: Performance of India's Co
- Page 547 and 548: 1970s hydropower accounted for arou
- Page 549 and 550: 35 Figure 18.8: India's Energy Savi
- Page 551 and 552: to compressed natural gas (CNG), wh
- Page 553 and 554: Delhi has encountered problems rela
- Page 555 and 556: Policy Scenario, it is assumed that
- Page 557 and 558: Figure 18.11: Change in Investment
- Page 559: tariffs in the services and industr
- Page 562 and 563: Background and Assumptions There ar
- Page 564 and 565: period by passenger cars, is the ma
- Page 566 and 567: Box 19.1: The Vehicle Stock in the
- Page 568 and 569: Oil and Gas The production profile
- Page 570 and 571: Electricity Electricity generation
- Page 572 and 573: in 2030 will still be low, at 2.7 t
- Page 574 and 575: and rising emissions of CO 2 , NO x
- Page 576 and 577: Outlook for Clean Cooking Fuel and
- Page 578 and 579: focus of government policy is to ex
- Page 580 and 581: The government has focused many pro
- Page 582 and 583: Expanding Access to Electricity in
- Page 584 and 585:
stoves. According to the World Heal
- Page 586 and 587:
Subsidies on Kerosene and LPG, and
- Page 588 and 589:
Uttar Pradesh (4.4 million) and Wes
- Page 591:
ANNEXES
- Page 594 and 595:
Reference Scenario: World Energy de
- Page 596 and 597:
Alternative Policy Scenario: World
- Page 598 and 599:
Reference Scenario: China Energy de
- Page 600 and 601:
Alternative Policy Scenario: China
- Page 602 and 603:
Reference Scenario: India Energy de
- Page 604 and 605:
Alternative Policy Scenario: India
- Page 606 and 607:
Reference Scenario: OECD Energy dem
- Page 608 and 609:
Reference Scenario: OECD North Amer
- Page 610 and 611:
Reference Scenario: United States E
- Page 612 and 613:
Reference Scenario: OECD Pacific En
- Page 614 and 615:
Reference Scenario: Japan Energy de
- Page 616 and 617:
Reference Scenario: OECD Europe Ene
- Page 618 and 619:
Reference Scenario: European Union
- Page 620 and 621:
Reference Scenario: Transition econ
- Page 622 and 623:
Reference Scenario: Russia Energy d
- Page 624 and 625:
Reference Scenario: Developing coun
- Page 626 and 627:
Reference Scenario: Developing Asia
- Page 628 and 629:
Reference Scenario: Latin America E
- Page 630 and 631:
Reference Scenario: Middle East Ene
- Page 632 and 633:
Reference Scenario: Africa Energy d
- Page 635 and 636:
ANNEX B ABBREVIATIONS, DEFINITIONS
- Page 637 and 638:
Coal-bed Methane Methane found in c
- Page 639 and 640:
Other Renewables Includes geotherma
- Page 641 and 642:
international marine bunkers, excep
- Page 643:
Rest of Developing Asia Developing
- Page 646 and 647:
IAEA IEA IGCC IMF IOC IPCC IPP LDV
- Page 649 and 650:
ANNEX D REFERENCES Introduction Int
- Page 651 and 652:
Stevens, C. and J. Kennan (2006), H
- Page 653 and 654:
— (2004), World Energy Outlook 20
- Page 655 and 656:
International Energy Agency (IEA, 2
- Page 657 and 658:
Chew Chong Siang (2006), Current St
- Page 659 and 660:
Williams, R. O., A. McKane et al. (
- Page 661 and 662:
Garg, A. et al. (2006), “The sect
- Page 663 and 664:
Malti, G. (2007), Carbon Capture an
- Page 665:
Pachauri, S. (2007), An Energy Anal
- Page 674:
IEA PUBLICATIONS, 9, rue de la Féd