- Page 2:
This page intentionally left blank
- Page 8:
Syndromes of Corruption: Wealth, Po
- Page 12:
For Betsy, always.
- Page 18:
Figures 2.1 Human development and c
- Page 22:
Preface ‘‘I have seen the futur
- Page 26:
xii Preface assistants; the Office
- Page 32:
1 Wealth, power, and corruption Thr
- Page 36:
Wealth, power, and corruption 3 fou
- Page 40:
Wealth, power, and corruption 5 tel
- Page 44:
Wealth, power, and corruption 7 mos
- Page 48:
Wealth, power, and corruption 9 If
- Page 52:
Wealth, power, and corruption 11 De
- Page 56:
Wealth, power, and corruption 13 sp
- Page 60:
Wealth, power, and corruption 15 re
- Page 64:
The international setting 17 All th
- Page 68:
The international setting 19 or une
- Page 72:
The international setting 21 the br
- Page 76:
The international setting 23 becaus
- Page 80:
The international setting 25 and bu
- Page 84:
The international setting 27 and Al
- Page 88:
The international setting 29 develo
- Page 92:
The international setting 31 indeed
- Page 96:
The international setting 33 extens
- Page 100:
The international setting 35 compar
- Page 104:
Participation, institutions, and sy
- Page 108:
Participation, institutions, and sy
- Page 112:
Participation, institutions, and sy
- Page 116:
Participation, institutions, and sy
- Page 120:
Participation, institutions, and sy
- Page 124:
Participation, institutions, and sy
- Page 128:
Participation, institutions, and sy
- Page 132:
Participation, institutions, and sy
- Page 136:
Participation, institutions, and sy
- Page 140:
Table 3.3: Corruption and developme
- Page 144:
Participation, institutions, and sy
- Page 148:
Participation, institutions, and sy
- Page 152:
Influence Markets 61 disillusionmen
- Page 156:
Influence Markets 63 highly visible
- Page 160:
Influence Markets 65 of 1971. That
- Page 164:
Influence Markets 67 limits apply t
- Page 168:
Influence Markets 69 indicted in 19
- Page 172:
Influence Markets 71 risk may be ex
- Page 176:
Influence Markets 73 with hard mone
- Page 180:
Influence Markets 75 and the highes
- Page 184:
Influence Markets 77 What of the lo
- Page 188:
Influence Markets 79 paid large bri
- Page 192:
Influence Markets 81 political part
- Page 196:
Influence Markets 83 interventions
- Page 200:
Influence Markets 85 nearly impossi
- Page 204:
Influence Markets 87 anti-corruptio
- Page 208:
5 Elite Cartels: how to buy friends
- Page 212:
Elite Cartels 91 hegemony anchored
- Page 216:
Elite Cartels 93 lower than for the
- Page 220:
Elite Cartels 95 DC-led coalition t
- Page 224:
Elite Cartels 97 The rapid rise in
- Page 228:
Elite Cartels 99 that was part of i
- Page 232:
Elite Cartels 101 parties’’ in
- Page 236:
Elite Cartels 103 Korea: ‘‘mone
- Page 240:
Elite Cartels 105 a personalized vi
- Page 244:
Elite Cartels 107 and charities. Du
- Page 248:
Elite Cartels 109 his presidency (1
- Page 252:
Elite Cartels 111 their power; afte
- Page 256:
Elite Cartels 113 predict, and pote
- Page 260:
Elite Cartels 115 Botswana: an Elit
- Page 264:
Elite Cartels 117 As in many patron
- Page 268:
Elite Cartels 119 vantage-point of
- Page 272:
Oligarchs and Clans 121 Opportunity
- Page 276:
Oligarchs and Clans 123 Table 6.1:
- Page 280:
Oligarchs and Clans 125 Russia has
- Page 284:
Oligarchs and Clans 127 first Presi
- Page 288:
Oligarchs and Clans 129 all. In 200
- Page 292:
Oligarchs and Clans 131 The Soviet
- Page 296:
Oligarchs and Clans 133 After the f
- Page 300:
Oligarchs and Clans 135 Oligarchs,
- Page 304:
Oligarchs and Clans 137 and the Uni
- Page 308:
Oligarchs and Clans 139 administrat
- Page 312:
Oligarchs and Clans 141 election fr
- Page 316:
Oligarchs and Clans 143 General Fid
- Page 320:
Oligarchs and Clans 145 the PRI’s
- Page 324:
Oligarchs and Clans 147 effective,
- Page 328:
Oligarchs and Clans 149 kickbacks,
- Page 332:
Oligarchs and Clans 151 not object
- Page 336:
Oligarchs and Clans 153 different s
- Page 340:
7 Official Moguls: reach out and sq
- Page 344:
Official Moguls 157 Table 7.1: Stat
- Page 348:
Official Moguls 159 of Suharto in 1
- Page 352:
Official Moguls 161 moonlighting, s
- Page 356:
Official Moguls 163 the Cultural Re
- Page 360:
Official Moguls 165 Increasingly Ch
- Page 364:
Official Moguls 167 hegemony, limit
- Page 368:
Official Moguls 169 and effective c
- Page 372:
Official Moguls 171 deteriorated in
- Page 376:
Official Moguls 173 officials and t
- Page 380:
Official Moguls 175 Kenya, in the e
- Page 384:
Official Moguls 177 conflict in som
- Page 388:
Official Moguls 179 (King, 2000; Co
- Page 392:
Official Moguls 181 percentages tha
- Page 396:
Official Moguls 183 higher on a cor
- Page 400:
Official Moguls 185 as a whole-soci
- Page 404:
From analysis to reform 187 What ha
- Page 408:
From analysis to reform 189 In many
- Page 412:
From analysis to reform 191 relativ
- Page 416:
From analysis to reform 193 cannot
- Page 420:
From analysis to reform 195 corrupt
- Page 424:
From analysis to reform 197 emphasi
- Page 428: From analysis to reform 199 counter
- Page 432: From analysis to reform 201 democra
- Page 436: From analysis to reform 203 incumbe
- Page 440: From analysis to reform 205 coloniz
- Page 444: From analysis to reform 207 corrupt
- Page 448: From analysis to reform 209 Bureauc
- Page 452: From analysis to reform 211 resumpt
- Page 456: From analysis to reform 213 forms:
- Page 460: From analysis to reform 215 Are we
- Page 464: From analysis to reform 217 democra
- Page 468: From analysis to reform 219 between
- Page 472: Appendix A: Countries in each clust
- Page 476: Appendix A 223 Group 3: Oligarchs a
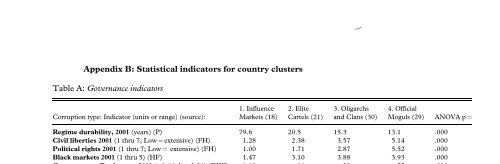
- Page 482: Table B: Social indicators Corrupti
- Page 486: References Note: ‘‘JRL,’’ w
- Page 490: 230 References Besley, Timothy, and
- Page 494: 232 References Coalson, Robert. 200
- Page 498: 234 References El Universal. 2004.
- Page 502: 236 References Gong, Ting (Kung T`i
- Page 506: 238 References Humphrey, Caroline.
- Page 510: 240 References 2005b. ‘‘Measuri
- Page 514: 242 References Knack, S., and Phili
- Page 518: 244 References MacIntyre, Andrew. 2
- Page 522: 246 References 2002b. ‘‘Russia
- Page 526: 248 References 2005. ‘‘Contribu
- Page 530:
250 References Ross, Stanley D. 199
- Page 534:
252 References Singleton, Solveig.
- Page 538:
254 References 2004a. ‘‘The FEC
- Page 542:
256 References World Factbook Onlin
- Page 546:
258 Index bribery 10, 24 in America
- Page 550:
260 Index Elite Cartel corruption (
- Page 554:
262 Index Japan (cont.) state burea
- Page 558:
264 Index Oligarch and Clan corrupt
- Page 562:
266 Index scandals (cont.) Influenc