CORRUPTION Syndromes of Corruption
CORRUPTION Syndromes of Corruption
CORRUPTION Syndromes of Corruption

Create successful ePaper yourself
Turn your PDF publications into a flip-book with our unique Google optimized e-Paper software.
The international setting 33<br />
extensive corruption; to make the following discussion more intuitive,<br />
I have subtracted scores from ten so that a larger value indicates perceptions<br />
<strong>of</strong> more corruption.<br />
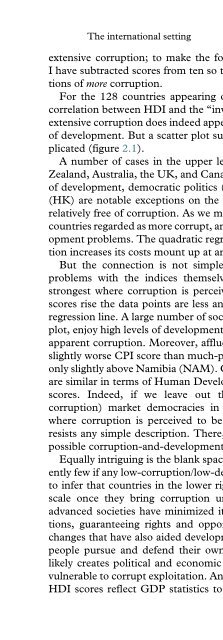
For the 128 countries appearing on both indices, the simple linear<br />
correlation between HDI and the ‘‘inverted’’ TI index is -.71 (p ¼ .000):<br />
extensive corruption does indeed appear strongly linked with lower levels<br />
<strong>of</strong> development. But a scatter plot suggests that matters are more complicated<br />
(figure 2.1).<br />
A number <strong>of</strong> cases in the upper left – Scandinavian countries, New<br />
Zealand, Australia, the UK, and Canada among them – enjoy high levels<br />
<strong>of</strong> development, democratic politics (Singapore (SIN) and Hong Kong<br />
(HK) are notable exceptions on the latter point), and are perceived as<br />
relatively free <strong>of</strong> corruption. As we move toward the lower right we find<br />
countries regarded as more corrupt, and facing increasingly serious development<br />
problems. The quadratic regression line suggests that as corruption<br />
increases its costs mount up at an increasing rate.<br />
But the connection is not simple or consistent. Quite apart from<br />
problems with the indices themselves, links to development appear<br />
strongest where corruption is perceived to be least important: as CPI<br />
scores rise the data points are less and less tightly clustered around the<br />
regression line. A large number <strong>of</strong> societies, arrayed across the top <strong>of</strong> the<br />
plot, enjoy high levels <strong>of</strong> development despite widely varying amounts <strong>of</strong><br />
apparent corruption. Moreover, affluent Italy (ITA), for example, has a<br />
slightly worse CPI score than much-poorer Botswana (BOT), and ranks<br />
only slightly above Namibia (NAM). Chile (CHL) and Argentina (ARG)<br />
are similar in terms <strong>of</strong> Human Development, but have very different TI<br />
scores. Indeed, if we leave out the affluent (and reputedly lowcorruption)<br />
market democracies in the top left and focus on those<br />
where corruption is perceived to be most important, the relationship<br />
resists any simple description. There, it seems, we have many different<br />
possible corruption-and-development stories to tell.<br />
Equally intriguing is the blank space in the lower left: there are apparently<br />
few if any low-corruption/low-development societies. It is tempting<br />
to infer that countries in the lower right will move up the development<br />
scale once they bring corruption under control. More likely is that<br />
advanced societies have minimized it in the course <strong>of</strong> building institutions,<br />
guaranteeing rights and opportunities, and making other basic<br />
changes that have also aided development (Rodrik, 2003) and that help<br />
people pursue and defend their own interests. Development, in turn,<br />
likely creates political and economic alternatives that leave people less<br />
vulnerable to corrupt exploitation. And it is also worth remembering that<br />
HDI scores reflect GDP statistics to a significant extent; in fact, if we