- Page 1:
International Review of Waste Manag
- Page 4 and 5:
29/09/09
- Page 6 and 7:
ii 32.0 Levy on Waste Paints - Inte
- Page 8 and 9:
Glossary of Acronyms iv 29/09/09 AB
- Page 10 and 11:
vi 29/09/09 MSW Municipal solid was
- Page 13 and 14:
WASTE POLICIES - EXISTING FRAMEWORK
- Page 15 and 16:
3 departing from the hierarchy wher
- Page 17 and 18:
7. The inclusion of measures to pre
- Page 19 and 20:
7 Reuse; Reuse; Reuse; for example
- Page 21 and 22:
ut both grow. “Absolute decouplin
- Page 23 and 24:
1.4 Waste Recycling and Composting
- Page 25 and 26:
13 waste from these sources. Member
- Page 27 and 28:
Management (Food Waste) Regulations
- Page 29 and 30:
17 Such measures may include an acc
- Page 31 and 32:
19 � endeavour to reduce the use
- Page 33 and 34:
21 the European Union. Apart from l
- Page 35 and 36:
23 1. Member States shall set up a
- Page 37 and 38:
1.6 The Incineration Directive The
- Page 39 and 40:
1.7 The UNECE / Stockholm Conventio
- Page 41 and 42:
29 � Lindane to Annex A; � Pent
- Page 43 and 44:
2.0 Policy Instruments for Waste Ma
- Page 45 and 46:
33 agencies), and occasionally unde
- Page 47 and 48:
Mechanisms which operate through th
- Page 49 and 50:
identical, but in practice they hav
- Page 51 and 52:
39 that firms may still need to be
- Page 53 and 54:
41 � Recycling investment tax cre
- Page 55 and 56:
43 � Lack of communication betwee
- Page 57 and 58:
3.2 Issues with Current Situation I
- Page 59 and 60:
47 Greenstar claims that when the l
- Page 61 and 62:
3.3 Market Failure Currently in Ire
- Page 63 and 64:
51 franchise agreements reduce the
- Page 65 and 66:
as set out by the EU is limited in
- Page 67 and 68:
The beneficial network effects, or
- Page 69 and 70:
3.6 Recommendations What is often d
- Page 71 and 72:
59 which was designed to reflect a
- Page 73 and 74:
61 1. Whether the private sector ha
- Page 75 and 76:
4.0 The Role of Local Authorities 4
- Page 77 and 78:
that there have been no significant
- Page 79 and 80:
Local authorities have no obvious m
- Page 81 and 82:
introduced (and under which, they w
- Page 83 and 84:
71 International Review of Waste Po
- Page 85 and 86:
statutory waste management plans. I
- Page 87 and 88:
Each region has devised, and period
- Page 89 and 90:
uneconomic infrastructure and regio
- Page 91 and 92:
79 programme of measures to achieve
- Page 93 and 94:
Waste referred to in paragraph 1 is
- Page 95 and 96:
It is suggested that the regions sh
- Page 97 and 98:
6.0 Review of Irish Policy on Preve
- Page 99 and 100:
2. High quality data relating to wa
- Page 101 and 102:
company linked to the municipality
- Page 103 and 104:
infrastructure with a high emphasis
- Page 105 and 106:
93 and liaise with local authoritie
- Page 107 and 108:
To date the Market Development Grou
- Page 109 and 110:
Table 6-1: Generation of Municipal
- Page 111 and 112:
No adjustment was made to the proje
- Page 113 and 114:
whilst initiatives for unsolicited
- Page 115 and 116:
7.0 Pay-By-Use - Ireland 7.1 Outlin
- Page 117 and 118:
One of the waste management commitm
- Page 119 and 120:
eporting in the Annual National Was
- Page 121 and 122:
109 � In the absence of a kerbsid
- Page 123 and 124:
in case study areas, and an increas
- Page 125 and 126:
shifts/by separate staff, which in
- Page 127 and 128:
not reflected in reduced costs to c
- Page 129 and 130:
extent to which this compromises an
- Page 131 and 132:
and residual waste fee not so great
- Page 133 and 134:
121 � Choosing collection schemes
- Page 135 and 136:
8.3 Key Organisations Involved in I
- Page 137 and 138:
of material generated as waste (sin
- Page 139 and 140:
Figure 8-2: Balance of Costs and Be
- Page 141 and 142:
counterfactual. This type of approa
- Page 143 and 144:
131 � Bin-volume based (i.e. wher
- Page 145 and 146:
133 � Sack-based schemes with cha
- Page 147 and 148:
Table 8-4: Costs under Flat Rate Fe
- Page 149 and 150:
to this type of abuse given a) its
- Page 151 and 152:
the effect of certain variables on
- Page 153 and 154:
effects are not always verifiable i
- Page 155 and 156:
A French study (results shown in Fi
- Page 157 and 158:
Therefore, it would seem reasonable
- Page 159 and 160:
In many jurisdictions, where the pr
- Page 161 and 162:
149 “M&S [Marks & Spencer] sell t
- Page 163 and 164:
cost of residual waste treatment is
- Page 165 and 166:
eduction in waste quantities. The m
- Page 167 and 168:
A useful report on illegal dumping,
- Page 169 and 170:
Generally, the view which prevails
- Page 171 and 172:
9.0 Pay-by-use - Germany 9.1 Outlin
- Page 173 and 174:
Table 9-2: Charges for Residual Was
- Page 175 and 176:
163 Environmental Advisors (Sachver
- Page 177 and 178:
Figure 9-2: Quantities of Residual
- Page 179 and 180:
The bulky waste collections, Figure
- Page 181 and 182:
The net effect of these changes for
- Page 183 and 184:
the market such as waste sluices (e
- Page 185 and 186:
Prior to the system’s introductio
- Page 187 and 188:
The case of Schweinfurt is truly ou
- Page 189 and 190:
10.1.2 Approaches to Selective Coll
- Page 191 and 192:
10.4 Key Organisations Involved in
- Page 193 and 194:
FOST-Plus reports the following col
- Page 195 and 196:
to recover costs in such a way that
- Page 197 and 198:
11.0 Landfill Levy - Ireland 11.1 O
- Page 199 and 200:
187 � Landfill operators. Local A
- Page 201 and 202:
Table 11-2: Trends in Household Was
- Page 203 and 204:
191 • The effects of the Repak Pa
- Page 205 and 206:
positive. In 2007, of the €32,398
- Page 207 and 208:
11.8 Response from Public and Indus
- Page 209 and 210:
When the landfill levy was first in
- Page 211 and 212:
12.0 Producer Responsibility, Packa
- Page 213 and 214:
Although the European legislation d
- Page 215 and 216:
Table 12-1: Distribution of Respons
- Page 217 and 218:
205 (v) 15% by weight for wood, sup
- Page 219 and 220:
207 Companies that supply packaging
- Page 221 and 222:
Data from both Repak and self-compl
- Page 223 and 224:
Table 12-3: Average Compound Rate o
- Page 225 and 226:
The EEA report identifies the role
- Page 227 and 228:
The same study went on to highlight
- Page 229 and 230:
217 materials at source, effectivel
- Page 231 and 232:
and processors). In terms of the re
- Page 233 and 234:
Repak members, and non-major produc
- Page 235 and 236:
In their submission of information
- Page 237 and 238:
225 a. Direct costs of compliance (
- Page 239 and 240:
As noted above, there are differenc
- Page 241 and 242:
13.0 Producer Responsibility, Packa
- Page 243 and 244:
Directive. The current Regulations
- Page 245 and 246:
each year by an Industrial Structur
- Page 247 and 248:
generally cheaper to collect as it
- Page 249 and 250:
Netherlands Netherlands Netherlands
- Page 251 and 252:
Figure 13-1: Packaging Recycling an
- Page 253 and 254:
Country Country 241 % % of of colle
- Page 255 and 256:
It can be seen that against this me
- Page 257 and 258:
Figure 13-4: German License Fees Pa
- Page 259 and 260:
This is likely to have been depende
- Page 261 and 262:
Table 13-9: Financing Sources for R
- Page 263 and 264:
iv) Operational Operational Operati
- Page 265 and 266:
14.0 Producer Responsibility, Packa
- Page 267 and 268:
Table 14-2: Operators of Dual Syste
- Page 269 and 270:
provided by the DSD. Through the DS
- Page 271 and 272:
Following a poll in 2004, it became
- Page 273 and 274:
packaging has to be licensed by the
- Page 275 and 276:
15.0 Producer Responsibility - Flan
- Page 277 and 278:
265 � The industrial federations
- Page 279 and 280:
used to reimburse (inter)municipali
- Page 281 and 282:
Consumers can bring old and expired
- Page 283 and 284:
15.3.7 Waste Tyres The implementati
- Page 285 and 286:
273 � which treatment facilities
- Page 287 and 288:
VALORFRIT reimburses the municipali
- Page 289 and 290:
Figure 15-3: Belgian Packaging Wast
- Page 291 and 292:
279 � Widespread use of PBU; �
- Page 293 and 294:
Figure 15-4: Collection for Recycli
- Page 295 and 296:
283 � by January 2015, reuse and
- Page 297 and 298:
RECUPEL has continually sampled 5 %
- Page 299 and 300:
is currently being performed to ide
- Page 301 and 302:
Table 15-7 Green Dot Fees for Packa
- Page 303 and 304:
Moreover, the provisions of BEBAT n
- Page 305 and 306:
293 • All other types of oil gene
- Page 307 and 308:
procedure. It would be considerably
- Page 309 and 310:
16.0 Deposit Refund Systems - Inter
- Page 311 and 312:
same order as the cost savings from
- Page 313 and 314:
Country Country System System Year
- Page 315 and 316:
Country Country System System Year
- Page 317 and 318:
Country Country System System Year
- Page 319 and 320:
Country Country System System Year
- Page 321 and 322:
NT$13.01 per kg (US$0.39 at January
- Page 323 and 324:
collectors. These super-collectors
- Page 325 and 326:
A study in 2002 reviewed the outcom
- Page 327 and 328:
315 The existing studies show that
- Page 329 and 330:
Figure 16-2: Performance of US Stat
- Page 331 and 332:
Figure 16-5: Return Percentages of
- Page 333 and 334:
This is not to deny the possibility
- Page 335 and 336:
323 in in in packaging, packaging,
- Page 337 and 338:
harm caused by plastics in the mari
- Page 339 and 340:
327 Deposit containers would be tra
- Page 341 and 342:
have to be compared with the costs
- Page 343 and 344:
Of particular interest are some of
- Page 345 and 346:
Figure 16-7: Economic Cost per Tonn
- Page 347 and 348:
One of the concerns within Europe h
- Page 349 and 350:
(e.g. brought from Germany) so that
- Page 351 and 352:
Another pre-requisite, partly becau
- Page 353 and 354:
341 International Review of Waste P
- Page 355 and 356:
343 � Council of Environmental Ad
- Page 357 and 358:
step towards turning people away fr
- Page 359 and 360:
The sectors that profited from the
- Page 361 and 362:
349 � Willingness of the industry
- Page 363 and 364:
Green-Schools is run by An Taisce f
- Page 365 and 366:
18.3 When was the Policy Introduced
- Page 367 and 368:
355 � Green Homes: The Green Home
- Page 369 and 370:
Figure 18-1: Green Homes Research -
- Page 371 and 372:
composter. There are similar saving
- Page 373 and 374:
information on the various themes i
- Page 375 and 376:
Producers must register with the na
- Page 377 and 378:
365 • 2008: The Waste Management
- Page 379 and 380:
367 • Approved producer complianc
- Page 381 and 382:
the generation of electrical and el
- Page 383 and 384:
80% of WEEE primary processing take
- Page 385 and 386:
outed to charities and schools to d
- Page 387 and 388:
since June 2006 to guide and co-ord
- Page 389 and 390:
377 � Category 10 - Automatic dis
- Page 391 and 392:
table are the ‘2008 Review of Dir
- Page 393 and 394:
National National Register Register
- Page 395 and 396:
383 � The financial structures as
- Page 397 and 398:
purchased), though some offer it vo
- Page 399 and 400:
In order to facilitate their financ
- Page 401 and 402:
that product, the risk that the mat
- Page 403 and 404:
particular streams of WEEE. For exa
- Page 405 and 406:
Table 20-2 gives the amount of each
- Page 407 and 408:
demand that the receiving facilitie
- Page 409 and 410:
Table 20-3: Range of Total Costs fo
- Page 411 and 412:
kg), and a TV (15 kg), finding the
- Page 413 and 414:
20.10 Lessons Learned Administrativ
- Page 415 and 416:
Historical and ‘orphan’ waste,
- Page 417 and 418:
in 2012. Hence, the revision may im
- Page 419 and 420:
equipment. Furthermore producers do
- Page 421 and 422:
409 � 31 st December 2005: Almost
- Page 423 and 424:
411 � Regarding “new” WEEE (e
- Page 425 and 426:
ate of WEEE collected after the int
- Page 427 and 428:
A serious problem is the illegal ex
- Page 429 and 430: 22.0 Producer Responsibility, ELVs
- Page 431 and 432: practice previously resulted in the
- Page 433 and 434: 421 of that producer's brand or for
- Page 435 and 436: Ireland would be able to meet the r
- Page 437 and 438: 22.6.2 Environmental Benefits Assoc
- Page 439 and 440: According to this paper: 427 � Th
- Page 441 and 442: oth pieces of legislation is to res
- Page 443 and 444: 23.0 Producer Responsibility, ELVs
- Page 445 and 446: driven the reclamation industry to
- Page 447 and 448: 23.2.7 Country-specific Characteris
- Page 449 and 450: 23.2.9 Country-specific Characteris
- Page 451 and 452: In addition to the benefits associa
- Page 453 and 454: key reports highlight the importanc
- Page 455 and 456: Government in the form of additiona
- Page 457 and 458: affected. In any event, the effect
- Page 459 and 460: 447 happen and because a reasonable
- Page 461 and 462: 24.2 Policy Context and Reason for
- Page 463 and 464: time of writing, though it is under
- Page 465 and 466: 24.7 Environmental Benefits The Bat
- Page 467 and 468: 24.11 Social and Distributional Con
- Page 469 and 470: 25.0 Producer Responsibility, Batte
- Page 471 and 472: 459 � The competent authorities s
- Page 473 and 474: 1995. 537 This proliferation is pri
- Page 475 and 476: 463 � Countries where separate co
- Page 477 and 478: This has been possible under a broa
- Page 479: specific battery types, they might
- Page 483 and 484: 25.6.1.2 Retailer Take-back Schemes
- Page 485 and 486: Table 25-5: Average Cost per Kilogr
- Page 487 and 488: effectively be financed at a cost o
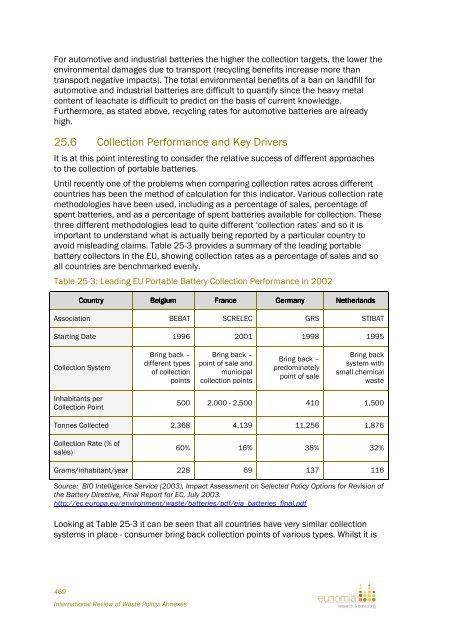
- Page 489 and 490: Collection methods in Europe have p
- Page 491 and 492: 26.2 Reasons for the Policy Accordi
- Page 493 and 494: 26.3 Key Organisations Involved in
- Page 495 and 496: Figure 26-2: German Battery Composi
- Page 497 and 498: 26.11 Evasion and Enforcement The c
- Page 499 and 500: 27.0 Plastic Bag Levy - Ireland 27.
- Page 501 and 502: 27.5.1 Evaluation Studies Available
- Page 503 and 504: 491 � Retailers find the effects
- Page 505 and 506: ags in 2003, compared with 36% in 1
- Page 507 and 508: 27.10 Social and Distributional Con
- Page 509 and 510: 27.14 Lessons Learned 27.14.1 Gener
- Page 511 and 512: 499 � Higher rates of recycling;
- Page 513 and 514: Table 28-2: The Organisation of the
- Page 515 and 516: same period of 9.8%. 600 The Danish
- Page 517 and 518: that only 8,000-10,000 businesses w
- Page 519 and 520: 28.12 Lessons Learned The Danish sc
- Page 521 and 522: a government body, the revenue is
- Page 523 and 524: 511 � Lubricating oil; � Antifr
- Page 525 and 526: Considering the impact on the consu
- Page 527 and 528: 30.0 Product Taxes - Belgium 30.1 O
- Page 529 and 530: and the Minister of Economic Affair
- Page 531 and 532:
Figure 30-1: Market Data on Single
- Page 533 and 534:
In order to achieve these targets,
- Page 535 and 536:
ecycling targets is partly linked t
- Page 537 and 538:
31.0 Plastic Bag Bans - Internation
- Page 539 and 540:
31.5 Environmental Benefits Environ
- Page 541 and 542:
32.0 Levy on Waste Paints - Interna
- Page 543 and 544:
The report concluded that total emp
- Page 545 and 546:
33.0 Circular WPPR 17/08 - Ireland
- Page 547 and 548:
private sector operators incur cost
- Page 549 and 550:
the organic waste fraction is no mo
- Page 551 and 552:
investments are utilised, will be i
- Page 553 and 554:
33.12 Complementary Policies Comple
- Page 555 and 556:
34.0 Minimum Recycling Standards (H
- Page 557 and 558:
paper/cardboard, metals (aluminium
- Page 559 and 560:
England and Wales (United Kingdom)
- Page 561 and 562:
householder/small commercial sector
- Page 563 and 564:
government is responsible for the w
- Page 565 and 566:
Indeed, there are clearly synergies
- Page 567 and 568:
strengthened as the increased costs
- Page 569 and 570:
from 15.4 % in 1994 to 49.2 % in 20
- Page 571 and 572:
materials. 675 Thus complementary p
- Page 573 and 574:
34.9 Effect of the Policy on Pricin
- Page 575 and 576:
� Strong industrial support via p
- Page 577 and 578:
municipality) unless it is composte
- Page 579 and 580:
City of Portland, Oregon (USA) The
- Page 581 and 582:
waste from manufacturing industries
- Page 583 and 584:
36.2.1 Country-specific Characteris
- Page 585 and 586:
solid pre-requisite for the product
- Page 587 and 588:
575 However, pending the adoption o
- Page 589 and 590:
where the abovementioned statutory
- Page 591 and 592:
36.5 Environmental Benefits The env
- Page 593 and 594:
Table 36-2 Amount (‘000 tonnes) o
- Page 595 and 596:
separated kitchen and garden waste,
- Page 597 and 598:
36.9 Effect of the Policy on Pricin
- Page 599 and 600:
product, especially when bioactive
- Page 601 and 602:
589 risk of contamination with othe
- Page 603 and 604:
37.4 Key Organisations Involved in
- Page 605 and 606:
37.6.1 Environmental Benefits - Pre
- Page 607 and 608:
For proposed new composting facilit
- Page 609 and 610:
597 • The contaminated batch and
- Page 611 and 612:
Table 38-1: Junk Mail Policies Name
- Page 613 and 614:
them to increase efforts at suppres
- Page 615 and 616:
Table 38-3: Cost Savings from Junk
- Page 617 and 618:
39.0 Review of Irish Policy, Constr
- Page 619 and 620:
39.1.2 Recycling of C&D Waste - Gen
- Page 621 and 622:
40.3 When was the Policy Introduced
- Page 623 and 624:
out in national policy and in the i
- Page 625 and 626:
currently working in this area and
- Page 627 and 628:
goals that are shared by the Nation
- Page 629 and 630:
617 waste minimisation and recyclin
- Page 631 and 632:
41.7 Environmental Benefits The rev
- Page 633 and 634:
to 2 per cent of the landfill levy,
- Page 635 and 636:
623 � the name of the accountable
- Page 637 and 638:
625 initiatives. In other words, th
- Page 639 and 640:
environmental protection and optimu
- Page 641 and 642:
The NCDWC had a high level of suppo
- Page 643 and 644:
42.15 Lessons Learned For the purpo
- Page 645 and 646:
mandatory to varying degrees in Eng
- Page 647 and 648:
Japan 635 � Monitoring and auditi
- Page 649 and 650:
Hong Kong Industry surveying and in
- Page 651 and 652:
Table 43-1: Estimated Total Cost of
- Page 653 and 654:
43.8 Social and Distributional Cons
- Page 655 and 656:
short time frame over which it has
- Page 657 and 658:
In December 2007, Mr. John Gormley,
- Page 659 and 660:
647 of waste recovered at the facil
- Page 661 and 662:
44.13 Effect of the Policy on Prici
- Page 663 and 664:
implementing and managing the Proto
- Page 665 and 666:
46.0 Tax on Aggregates - Internatio
- Page 667 and 668:
The UK’s ‘Aggregate Levy’ app
- Page 669 and 670:
The following study is a comparison
- Page 671 and 672:
The intention to implement a landfi
- Page 673 and 674:
has encouraged innovation in recycl
- Page 675 and 676:
46.9.1 Quality Standards European S
- Page 677 and 678:
665 � if one fails to deregister,
- Page 679 and 680:
47.0 Product Standards for Aggregat
- Page 681 and 682:
It lays down regulations and standa
- Page 683 and 684:
has been recognised that recycled o
- Page 685 and 686:
48.0 Minimum Recycling Standards (C
- Page 687 and 688:
Companies are obliged to either sep
- Page 689 and 690:
Table 48-2: Construction and Demoli
- Page 691 and 692:
Construction and demolition project
- Page 693 and 694:
Belgium Following Article 16 in Cha
- Page 695 and 696:
The UK Environment Agency have buil
- Page 697 and 698:
during Construction Work came into
- Page 699 and 700:
codes. For example, Korea introduce
- Page 701 and 702:
In Japan, the lead contractor is re
- Page 703 and 704:
50.0 Minimum Recycling Standards (C
- Page 705 and 706:
POLICIES FOR RESIDUAL WASTE 693 Int
- Page 707 and 708:
695 advance the Commission of their
- Page 709 and 710:
have stabilised over the last six y
- Page 711 and 712:
ased instruments, or through regula
- Page 713 and 714:
Figure 51-4: Materials Captured (re
- Page 715 and 716:
200,000 tonnes, though some of this
- Page 717 and 718:
tonnes early in 2010, and as much a
- Page 719 and 720:
We discuss the matters further belo
- Page 721 and 722:
as was made clear above, the inclus
- Page 723 and 724:
51.4.2.3 Comment on Targets A conce
- Page 725 and 726:
seem that there is little or no bas
- Page 727 and 728:
It acknowledges the role of a numbe
- Page 729 and 730:
The proposed minimum pre-treatment
- Page 731 and 732:
719 The introduction of this measur
- Page 733 and 734:
The growing strength of these inter
- Page 735 and 736:
It goes on: 723 fully stabilised wa
- Page 737 and 738:
of electricity consumption from ren
- Page 739 and 740:
52.0 Policies Aimed at Discouraging
- Page 741 and 742:
promote cost effective means of res
- Page 743 and 744:
authorities work jointly on a strat
- Page 745 and 746:
Table 52-1: Summary of Measures by
- Page 747 and 748:
It is illuminating to note that in
- Page 749 and 750:
737 implemented to make treatment o
- Page 751 and 752:
environmental projects, and 45% is
- Page 753 and 754:
enclosure; and ii) municipal waste
- Page 755 and 756:
52.2.4.4 Finland In 1993, two years
- Page 757 and 758:
The objectives of the waste tax are
- Page 759 and 760:
52.2.4.10 Country-specific Characte
- Page 761 and 762:
meant to finance the Modernisation
- Page 763 and 764:
751 - 1995: Publication of a regula
- Page 765 and 766:
esidual treatments, and thus exempt
- Page 767 and 768:
incineration facilities produce ele
- Page 769 and 770:
There are several bands in this tax
- Page 771 and 772:
educe the quantity, or improve the
- Page 773 and 774:
761 announced in the November 1995
- Page 775 and 776:
52.4 Evaluation Studies Available I
- Page 777 and 778:
disposal costs necessarily would le
- Page 779 and 780:
discernible change in the trend in
- Page 781 and 782:
A report on Finnish waste managemen
- Page 783 and 784:
some cases, notably in the foundry
- Page 785 and 786:
absence of any form of waste tax. F
- Page 787 and 788:
Netherlands and Sweden. One might a
- Page 789 and 790:
777 ‘the amount of landfilled was
- Page 791 and 792:
consequences of an incineration tax
- Page 793 and 794:
52.5.6 Reduction in Incineration As
- Page 795 and 796:
environmental performance. The land
- Page 797 and 798:
increase of between 30-100%. In Aus
- Page 799 and 800:
emaining residual waste separately.
- Page 801 and 802:
52.11 Evasion and Enforcement 52.11
- Page 803 and 804:
Table 52-7: Summary of Measures by
- Page 805 and 806:
� A clear rationale for the propo
- Page 807 and 808:
overall costs of household waste ma
- Page 809 and 810:
53.7 Effects on Technical Change /
- Page 811 and 812:
the costs for disposal in municipal
- Page 813 and 814:
801 � Old and expired medication.
- Page 815 and 816:
Even with high landfill levies, the
- Page 817 and 818:
Figure 54-4: Revenues from Flemish
- Page 819 and 820:
54.11 Lessons Learned A complex sys
- Page 821 and 822:
forge a genuinely ‘autonomous’
- Page 823 and 824:
administrations is deemed to change
- Page 825 and 826:
The desire to improve recycling per
- Page 827 and 828:
Table 55-2: BMW Landfilled in Engla
- Page 829 and 830:
55.6 Implementation Costs The inten
- Page 831 and 832:
context of UK waste management wher
- Page 833 and 834:
During 2007/08, the Environment Age
- Page 835 and 836:
823 � Market-relevant information
- Page 837 and 838:
need to consider not just ‘policy
- Page 839 and 840:
In the above scenario, with capture
- Page 841 and 842:
829 figures include nappies, as is
- Page 843 and 844:
of the order 65% would reduce the q
- Page 845 and 846:
56.2 Proposed Policies to Deal with
- Page 847 and 848:
2) Incineration, Incineration, Inci
- Page 849 and 850:
Table 56-1: Levies Proposed in RIA,
- Page 851 and 852:
839 dramatically reduced by margina
- Page 853 and 854:
4) Combustible waste 5) Waste excee
- Page 855 and 856:
843 Ew means annual energy containe
- Page 857 and 858:
OTHER POLICIES 845 International Re
- Page 859 and 860:
57.2 Benefits of Green Procurement
- Page 861 and 862:
what can, and what cannot be done,
- Page 863 and 864:
In light of the renewed EU Sustaina
- Page 865 and 866:
WRAP WRAP WRAP The greening of serv
- Page 867 and 868:
57.4.3 Washington State Recycling a
- Page 869 and 870:
ecommendation to do so in 2003 via
- Page 871 and 872:
859 environment into public procure
- Page 873 and 874:
has created a ‘level playing fiel
- Page 875 and 876:
Article 6 of Regulation (EC) No.850
- Page 877 and 878:
epresentations in relation to this
- Page 879 and 880:
TARGET SETTING 867 International Re
- Page 881 and 882:
specific actors, or failing that, t
- Page 883 and 884:
policy has not been sufficiently re
- Page 885 and 886:
873 ban only ensures the best use o
- Page 887 and 888:
ecent reports from PROGNOS, the EEA
- Page 889 and 890:
877 � Separate collection at the
- Page 891 and 892:
achieves this rate country wide. So
- Page 893 and 894:
Figure 59-3: Recycling Rates Around
- Page 895 and 896:
Box 2: Recycling Centres in Upper A
- Page 897 and 898:
Source: Eunomia (2007) Scoping new
- Page 899 and 900:
Figure 59-8: Recycling Rates Achiev
- Page 901 and 902:
absolute terms, i.e. in terms of we
- Page 903 and 904:
verbrandbaar bouw- en sloopafval”
- Page 905 and 906:
Figure 59-10: Flanders Residual Was
- Page 907 and 908:
there does appear to have been a sl
- Page 909 and 910:
Figure 59-12: Residual Waste per In
- Page 911 and 912:
899 • The total ‘better than ta
- Page 913 and 914:
GRANT FUNDING 901 International Rev
- Page 915 and 916:
NDP 2000-2006 Waste management & wa
- Page 917 and 918:
authority projects approved for ass
- Page 919 and 920:
previously been available for such
- Page 921 and 922:
Table 60-1: Environment Fund Income
- Page 923 and 924:
een provided are available in the E
- Page 925 and 926:
additional 10% must be met by anoth
- Page 927 and 928:
Management Board (CIWMB) provide gr
- Page 929 and 930:
in place. This is very often to ena
- Page 931 and 932:
However, earmarking reduces flexibi
- Page 933 and 934:
60.8 Approach to Evaluating Effects
- Page 935 and 936:
There is evidence to suggest that e
- Page 937 and 938:
925 � undertaking research on qua
- Page 939 and 940:
60.12 Lessons Learned The Flemish P
- Page 941 and 942:
929 might be axed in times of fundi
- Page 943 and 944:
61.0 Appraisal of Residual Waste Tr
- Page 945 and 946:
933 � Biogas for vehicle fuels?
- Page 947 and 948:
at landfill and incineration, but a
- Page 949 and 950:
handle. The choice of discount rate
- Page 951 and 952:
Other key variables of importance i
- Page 953 and 954:
treatment may give rise to damages,
- Page 955 and 956:
1. As described above (for basic st
- Page 957 and 958:
In addition to these UK focused stu
- Page 959 and 960:
Table 61-1: Externality Values for
- Page 961 and 962:
Transport externalities were incorp
- Page 963 and 964:
arrive at a ‘best estimate’ of
- Page 965 and 966:
than greenhouse gases. This is hard
- Page 967 and 968:
production, but mainly the much low
- Page 969 and 970:
Table 61-5: Summary of externality
- Page 971 and 972:
The second report, on the potential
- Page 973 and 974:
961 also given the fact that the st
- Page 975 and 976:
61.4 Concluding Remarks on the Lite
- Page 977 and 978:
965 associated with fuel used withi
- Page 979 and 980:
kg kg CO2 CO2 eq. eq. 62.1.1.2 Glob
- Page 981 and 982:
These results suggest a significant
- Page 983 and 984:
kg kg SO2 SO2 eq. eq. The results s
- Page 985 and 986:
62.1.2 Summary of Results In additi
- Page 987 and 988:
DALY, DALY, kg kg chloroethylene ch
- Page 989 and 990:
This is clearly true, not least sin
- Page 991 and 992:
979 � We have used two ‘sets’
- Page 993 and 994:
981 includes a dose-response model
- Page 995 and 996:
983 assessments is that the blanket
- Page 997 and 998:
our analysis, as well as those asso
- Page 999 and 1000:
Table 63-2: Emissions Avoided Throu
- Page 1001 and 1002:
the Swedish ORWARE model for contro
- Page 1003 and 1004:
instantaneous collection rates for
- Page 1005 and 1006:
etween 0.1 to 5 l CH4/m 2*h, so tha
- Page 1007 and 1008:
include up to 150 substances includ
- Page 1009 and 1010:
63.2.2.2 Landfill of Pre-treated Wa
- Page 1011 and 1012:
63.3.1.1 Energy Use at Incineration
- Page 1013 and 1014:
of a thermal efficiency of 84% and
- Page 1015 and 1016:
1003 data obtained from plant opera
- Page 1017 and 1018:
Table 63-13: Air Quality Externalit
- Page 1019 and 1020:
1007 1. Energy used within the trea
- Page 1021 and 1022:
1009 � Optimised biofilter; and
- Page 1023 and 1024:
Table 63-18: Results with Low Exter
- Page 1025 and 1026:
Table 63-19: Emissions Associated w
- Page 1027 and 1028:
metal, the production of which cons
- Page 1029 and 1030:
The two processes have similar envi
- Page 1031 and 1032:
Eunomia. 1263 The principal climate
- Page 1033 and 1034:
Figure 63-1: N-balance of a One Ste
- Page 1035 and 1036:
It should be noted that bioaerosols
- Page 1037 and 1038:
Table 63-27: Summary of Damage Cost
- Page 1039 and 1040:
If the biogas is cleaned of impurit
- Page 1041 and 1042:
the source of the natural gas, and
- Page 1043 and 1044:
Table 63-34: Summary of Damage Cost
- Page 1045 and 1046:
64.0 Costs of Household Waste Colle
- Page 1047 and 1048:
Within the following section we ass
- Page 1049 and 1050:
in place). It is possible to sense-
- Page 1051 and 1052:
Table 64-4: Household Annual Collec
- Page 1053 and 1054:
Table 64-6: Interpretation of WRAP
- Page 1055 and 1056:
1043 � Refuse collected weekly in
- Page 1057 and 1058:
The nature of these authorities the
- Page 1059 and 1060:
64.5 Collection Modelling for Irela
- Page 1061 and 1062:
ignore, however, is that whilst cos