Skandia Global Funds plc - Self Bank
Skandia Global Funds plc - Self Bank
Skandia Global Funds plc - Self Bank

You also want an ePaper? Increase the reach of your titles
YUMPU automatically turns print PDFs into web optimized ePapers that Google loves.
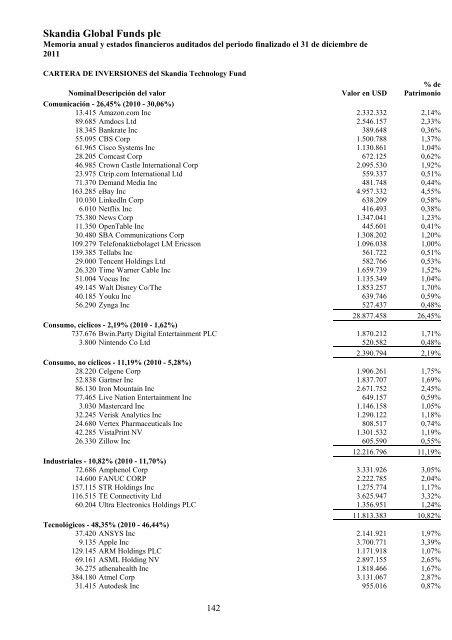
<strong>Skandia</strong> <strong>Global</strong> <strong>Funds</strong> <strong>plc</strong><br />
Memoria anual y estados financieros auditados del periodo finalizado el 31 de diciembre de<br />
2011<br />
CARTERA DE INVERSIONES del <strong>Skandia</strong> Technology Fund<br />
Nominal Descripción del valor<br />
Valor en USD<br />
% de<br />
Patrimonio<br />
Comunicación - 26,45% (2010 - 30,06%)<br />
13.415 Amazon.com Inc 2.332.332 2,14%<br />
89.685 Amdocs Ltd 2.546.157 2,33%<br />
18.345 <strong>Bank</strong>rate Inc 389.648 0,36%<br />
55.095 CBS Corp 1.500.788 1,37%<br />
61.965 Cisco Systems Inc 1.130.861 1,04%<br />
28.205 Comcast Corp 672.125 0,62%<br />
46.985 Crown Castle International Corp 2.095.530 1,92%<br />
23.975 Ctrip.com International Ltd 559.337 0,51%<br />
71.370 Demand Media Inc 481.748 0,44%<br />
163.285 eBay Inc 4.957.332 4,55%<br />
10.030 LinkedIn Corp 638.209 0,58%<br />
6.010 Netflix Inc 416.493 0,38%<br />
75.380 News Corp 1.347.041 1,23%<br />
11.350 OpenTable Inc 445.601 0,41%<br />
30.480 SBA Communications Corp 1.308.202 1,20%<br />
109.279 Telefonaktiebolaget LM Ericsson 1.096.038 1,00%<br />
139.385 Tellabs Inc 561.722 0,51%<br />
29.000 Tencent Holdings Ltd 582.766 0,53%<br />
26.320 Time Warner Cable Inc 1.659.739 1,52%<br />
51.004 Vocus Inc 1.135.349 1,04%<br />
49.145 Walt Disney Co/The 1.853.257 1,70%<br />
40.185 Youku Inc 639.746 0,59%<br />
56.290 Zynga Inc 527.437 0,48%<br />
28.877.458 26,45%<br />
Consumo, cíclicos - 2,19% (2010 - 1,62%)<br />
737.676 Bwin.Party Digital Entertainment PLC 1.870.212 1,71%<br />
3.800 Nintendo Co Ltd 520.582 0,48%<br />
2.390.794 2,19%<br />
Consumo, no cíclicos - 11,19% (2010 - 5,28%)<br />
28.220 Celgene Corp 1.906.261 1,75%<br />
52.838 Gartner Inc 1.837.707 1,69%<br />
86.130 Iron Mountain Inc 2.671.752 2,45%<br />
77.465 Live Nation Entertainment Inc 649.157 0,59%<br />
3.030 Mastercard Inc 1.146.158 1,05%<br />
32.245 Verisk Analytics Inc 1.290.122 1,18%<br />
24.680 Vertex Pharmaceuticals Inc 808.517 0,74%<br />
42.285 VistaPrint NV 1.301.532 1,19%<br />
26.330 Zillow Inc 605.590 0,55%<br />
12.216.796 11,19%<br />
Industriales - 10,82% (2010 - 11,70%)<br />
72.686 Amphenol Corp 3.331.926 3,05%<br />
14.600 FANUC CORP 2.222.785 2,04%<br />
157.115 STR Holdings Inc 1.275.774 1,17%<br />
116.515 TE Connectivity Ltd 3.625.947 3,32%<br />
60.204 Ultra Electronics Holdings PLC 1.356.951 1,24%<br />
11.813.383 10,82%<br />
Tecnológicos - 48,35% (2010 - 46,44%)<br />
37.420 ANSYS Inc 2.141.921 1,97%<br />
9.135 Apple Inc 3.700.771 3,39%<br />
129.145 ARM Holdings PLC 1.171.918 1,07%<br />
69.161 ASML Holding NV 2.897.155 2,65%<br />
36.275 athenahealth Inc 1.818.466 1,67%<br />
384.180 Atmel Corp 3.131.067 2,87%<br />
31.415 Autodesk Inc 955.016 0,87%<br />
142