Skandia Global Funds plc - Self Bank
Skandia Global Funds plc - Self Bank
Skandia Global Funds plc - Self Bank

You also want an ePaper? Increase the reach of your titles
YUMPU automatically turns print PDFs into web optimized ePapers that Google loves.
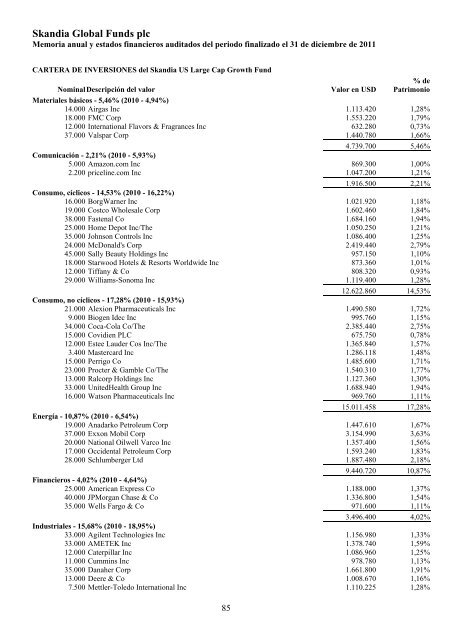
<strong>Skandia</strong> <strong>Global</strong> <strong>Funds</strong> <strong>plc</strong><br />
Memoria anual y estados financieros auditados del periodo finalizado el 31 de diciembre de 2011<br />
CARTERA DE INVERSIONES del <strong>Skandia</strong> US Large Cap Growth Fund<br />
Nominal Descripción del valor<br />
Valor en USD<br />
% de<br />
Patrimonio<br />
Materiales básicos - 5,46% (2010 - 4,94%)<br />
14.000 Airgas Inc 1.113.420 1,28%<br />
18.000 FMC Corp 1.553.220 1,79%<br />
12.000 International Flavors & Fragrances Inc 632.280 0,73%<br />
37.000 Valspar Corp 1.440.780 1,66%<br />
4.739.700 5,46%<br />
Comunicación - 2,21% (2010 - 5,93%)<br />
5.000 Amazon.com Inc 869.300 1,00%<br />
2.200 priceline.com Inc 1.047.200 1,21%<br />
1.916.500 2,21%<br />
Consumo, cíclicos - 14,53% (2010 - 16,22%)<br />
16.000 BorgWarner Inc 1.021.920 1,18%<br />
19.000 Costco Wholesale Corp 1.602.460 1,84%<br />
38.000 Fastenal Co 1.684.160 1,94%<br />
25.000 Home Depot Inc/The 1.050.250 1,21%<br />
35.000 Johnson Controls Inc 1.086.400 1,25%<br />
24.000 McDonald's Corp 2.419.440 2,79%<br />
45.000 Sally Beauty Holdings Inc 957.150 1,10%<br />
18.000 Starwood Hotels & Resorts Worldwide Inc 873.360 1,01%<br />
12.000 Tiffany & Co 808.320 0,93%<br />
29.000 Williams-Sonoma Inc 1.119.400 1,28%<br />
12.622.860 14,53%<br />
Consumo, no cíclicos - 17,28% (2010 - 15,93%)<br />
21.000 Alexion Pharmaceuticals Inc 1.490.580 1,72%<br />
9.000 Biogen Idec Inc 995.760 1,15%<br />
34.000 Coca-Cola Co/The 2.385.440 2,75%<br />
15.000 Covidien PLC 675.750 0,78%<br />
12.000 Estee Lauder Cos Inc/The 1.365.840 1,57%<br />
3.400 Mastercard Inc 1.286.118 1,48%<br />
15.000 Perrigo Co 1.485.600 1,71%<br />
23.000 Procter & Gamble Co/The 1.540.310 1,77%<br />
13.000 Ralcorp Holdings Inc 1.127.360 1,30%<br />
33.000 UnitedHealth Group Inc 1.688.940 1,94%<br />
16.000 Watson Pharmaceuticals Inc 969.760 1,11%<br />
15.011.458 17,28%<br />
Energía - 10,87% (2010 - 6,54%)<br />
19.000 Anadarko Petroleum Corp 1.447.610 1,67%<br />
37.000 Exxon Mobil Corp 3.154.990 3,63%<br />
20.000 National Oilwell Varco Inc 1.357.400 1,56%<br />
17.000 Occidental Petroleum Corp 1.593.240 1,83%<br />
28.000 Schlumberger Ltd 1.887.480 2,18%<br />
9.440.720 10,87%<br />
Financieros - 4,02% (2010 - 4,64%)<br />
25.000 American Express Co 1.188.000 1,37%<br />
40.000 JPMorgan Chase & Co 1.336.800 1,54%<br />
35.000 Wells Fargo & Co 971.600 1,11%<br />
3.496.400 4,02%<br />
Industriales - 15,68% (2010 - 18,95%)<br />
33.000 Agilent Technologies Inc 1.156.980 1,33%<br />
33.000 AMETEK Inc 1.378.740 1,59%<br />
12.000 Caterpillar Inc 1.086.960 1,25%<br />
11.000 Cummins Inc 978.780 1,13%<br />
35.000 Danaher Corp 1.661.800 1,91%<br />
13.000 Deere & Co 1.008.670 1,16%<br />
7.500 Mettler-Toledo International Inc 1.110.225 1,28%<br />
85