Skandia Global Funds plc - Self Bank
Skandia Global Funds plc - Self Bank
Skandia Global Funds plc - Self Bank

Create successful ePaper yourself
Turn your PDF publications into a flip-book with our unique Google optimized e-Paper software.
<strong>Skandia</strong> <strong>Global</strong> <strong>Funds</strong> <strong>plc</strong><br />
Memoria anual y estados financieros auditados del periodo finalizado el 31 de diciembre de<br />
2011<br />
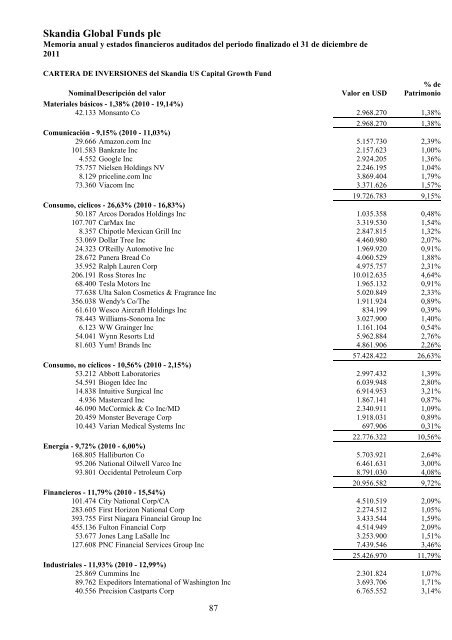
CARTERA DE INVERSIONES del <strong>Skandia</strong> US Capital Growth Fund<br />
Nominal Descripción del valor<br />
Valor en USD<br />
% de<br />
Patrimonio<br />
Materiales básicos - 1,38% (2010 - 19,14%)<br />
42.133 Monsanto Co 2.968.270 1,38%<br />
2.968.270 1,38%<br />
Comunicación - 9,15% (2010 - 11,03%)<br />
29.666 Amazon.com Inc 5.157.730 2,39%<br />
101.583 <strong>Bank</strong>rate Inc 2.157.623 1,00%<br />
4.552 Google Inc 2.924.205 1,36%<br />
75.757 Nielsen Holdings NV 2.246.195 1,04%<br />
8.129 priceline.com Inc 3.869.404 1,79%<br />
73.360 Viacom Inc 3.371.626 1,57%<br />
19.726.783 9,15%<br />
Consumo, cíclicos - 26,63% (2010 - 16,83%)<br />
50.187 Arcos Dorados Holdings Inc 1.035.358 0,48%<br />
107.707 CarMax Inc 3.319.530 1,54%<br />
8.357 Chipotle Mexican Grill Inc 2.847.815 1,32%<br />
53.069 Dollar Tree Inc 4.460.980 2,07%<br />
24.323 O'Reilly Automotive Inc 1.969.920 0,91%<br />
28.672 Panera Bread Co 4.060.529 1,88%<br />
35.952 Ralph Lauren Corp 4.975.757 2,31%<br />
206.191 Ross Stores Inc 10.012.635 4,64%<br />
68.400 Tesla Motors Inc 1.965.132 0,91%<br />
77.638 Ulta Salon Cosmetics & Fragrance Inc 5.020.849 2,33%<br />
356.038 Wendy's Co/The 1.911.924 0,89%<br />
61.610 Wesco Aircraft Holdings Inc 834.199 0,39%<br />
78.443 Williams-Sonoma Inc 3.027.900 1,40%<br />
6.123 WW Grainger Inc 1.161.104 0,54%<br />
54.041 Wynn Resorts Ltd 5.962.884 2,76%<br />
81.603 Yum! Brands Inc 4.861.906 2,26%<br />
57.428.422 26,63%<br />
Consumo, no cíclicos - 10,56% (2010 - 2,15%)<br />
53.212 Abbott Laboratories 2.997.432 1,39%<br />
54.591 Biogen Idec Inc 6.039.948 2,80%<br />
14.838 Intuitive Surgical Inc 6.914.953 3,21%<br />
4.936 Mastercard Inc 1.867.141 0,87%<br />
46.090 McCormick & Co Inc/MD 2.340.911 1,09%<br />
20.459 Monster Beverage Corp 1.918.031 0,89%<br />
10.443 Varian Medical Systems Inc 697.906 0,31%<br />
22.776.322 10,56%<br />
Energía - 9,72% (2010 - 6,00%)<br />
168.805 Halliburton Co 5.703.921 2,64%<br />
95.206 National Oilwell Varco Inc 6.461.631 3,00%<br />
93.801 Occidental Petroleum Corp 8.791.030 4,08%<br />
20.956.582 9,72%<br />
Financieros - 11,79% (2010 - 15,54%)<br />
101.474 City National Corp/CA 4.510.519 2,09%<br />
283.605 First Horizon National Corp 2.274.512 1,05%<br />
393.755 First Niagara Financial Group Inc 3.433.544 1,59%<br />
455.136 Fulton Financial Corp 4.514.949 2,09%<br />
53.677 Jones Lang LaSalle Inc 3.253.900 1,51%<br />
127.608 PNC Financial Services Group Inc 7.439.546 3,46%<br />
25.426.970 11,79%<br />
Industriales - 11,93% (2010 - 12,99%)<br />
25.869 Cummins Inc 2.301.824 1,07%<br />
89.762 Expeditors International of Washington Inc 3.693.706 1,71%<br />
40.556 Precision Castparts Corp 6.765.552 3,14%<br />
87