Skandia Global Funds plc - Self Bank
Skandia Global Funds plc - Self Bank
Skandia Global Funds plc - Self Bank

You also want an ePaper? Increase the reach of your titles
YUMPU automatically turns print PDFs into web optimized ePapers that Google loves.
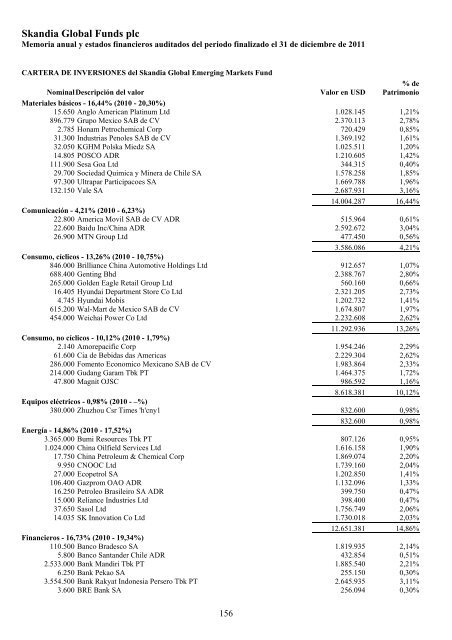
<strong>Skandia</strong> <strong>Global</strong> <strong>Funds</strong> <strong>plc</strong><br />
Memoria anual y estados financieros auditados del periodo finalizado el 31 de diciembre de 2011<br />
CARTERA DE INVERSIONES del <strong>Skandia</strong> <strong>Global</strong> Emerging Markets Fund<br />
Nominal Descripción del valor<br />
Valor en USD<br />
% de<br />
Patrimonio<br />
Materiales básicos - 16,44% (2010 - 20,30%)<br />
15.650 Anglo American Platinum Ltd 1.028.145 1,21%<br />
896.779 Grupo Mexico SAB de CV 2.370.113 2,78%<br />
2.785 Honam Petrochemical Corp 720.429 0,85%<br />
31.300 Industrias Penoles SAB de CV 1.369.192 1,61%<br />
32.050 KGHM Polska Miedz SA 1.025.511 1,20%<br />
14.805 POSCO ADR 1.210.605 1,42%<br />
111.900 Sesa Goa Ltd 344.315 0,40%<br />
29.700 Sociedad Quimica y Minera de Chile SA 1.578.258 1,85%<br />
97.300 Ultrapar Participacoes SA 1.669.788 1,96%<br />
132.150 Vale SA 2.687.931 3,16%<br />
14.004.287 16,44%<br />
Comunicación - 4,21% (2010 - 6,23%)<br />
22.800 America Movil SAB de CV ADR 515.964 0,61%<br />
22.600 Baidu Inc/China ADR 2.592.672 3,04%<br />
26.900 MTN Group Ltd 477.450 0,56%<br />
3.586.086 4,21%<br />
Consumo, cíclicos - 13,26% (2010 - 10,75%)<br />
846.000 Brilliance China Automotive Holdings Ltd 912.657 1,07%<br />
688.400 Genting Bhd 2.388.767 2,80%<br />
265.000 Golden Eagle Retail Group Ltd 560.160 0,66%<br />
16.405 Hyundai Department Store Co Ltd 2.321.205 2,73%<br />
4.745 Hyundai Mobis 1.202.732 1,41%<br />
615.200 Wal-Mart de Mexico SAB de CV 1.674.807 1,97%<br />
454.000 Weichai Power Co Ltd 2.232.608 2,62%<br />
11.292.936 13,26%<br />
Consumo, no cíclicos - 10,12% (2010 - 1,79%)<br />
2.140 Amorepacific Corp 1.954.246 2,29%<br />
61.600 Cia de Bebidas das Americas 2.229.304 2,62%<br />
286.000 Fomento Economico Mexicano SAB de CV 1.983.864 2,33%<br />
214.000 Gudang Garam Tbk PT 1.464.375 1,72%<br />
47.800 Magnit OJSC 986.592 1,16%<br />
8.618.381 10,12%<br />
Equipos eléctricos - 0,98% (2010 - –%)<br />
380.000 Zhuzhou Csr Times 'h'cny1 832.600 0,98%<br />
832.600 0,98%<br />
Energía - 14,86% (2010 - 17,52%)<br />
3.365.000 Bumi Resources Tbk PT 807.126 0,95%<br />
1.024.000 China Oilfield Services Ltd 1.616.158 1,90%<br />
17.750 China Petroleum & Chemical Corp 1.869.074 2,20%<br />
9.950 CNOOC Ltd 1.739.160 2,04%<br />
27.000 Ecopetrol SA 1.202.850 1,41%<br />
106.400 Gazprom OAO ADR 1.132.096 1,33%<br />
16.250 Petroleo Brasileiro SA ADR 399.750 0,47%<br />
15.000 Reliance Industries Ltd 398.400 0,47%<br />
37.650 Sasol Ltd 1.756.749 2,06%<br />
14.035 SK Innovation Co Ltd 1.730.018 2,03%<br />
12.651.381 14,86%<br />
Financieros - 16,73% (2010 - 19,34%)<br />
110.500 Banco Bradesco SA 1.819.935 2,14%<br />
5.800 Banco Santander Chile ADR 432.854 0,51%<br />
2.533.000 <strong>Bank</strong> Mandiri Tbk PT 1.885.540 2,21%<br />
6.250 <strong>Bank</strong> Pekao SA 255.150 0,30%<br />
3.554.500 <strong>Bank</strong> Rakyat Indonesia Persero Tbk PT 2.645.935 3,11%<br />
3.600 BRE <strong>Bank</strong> SA 256.094 0,30%<br />
156