Nationale Alleingänge oder internationale Kooperation? - Stiftung ...
Nationale Alleingänge oder internationale Kooperation? - Stiftung ...
Nationale Alleingänge oder internationale Kooperation? - Stiftung ...

Erfolgreiche ePaper selbst erstellen
Machen Sie aus Ihren PDF Publikationen ein blätterbares Flipbook mit unserer einzigartigen Google optimierten e-Paper Software.
Annex<br />
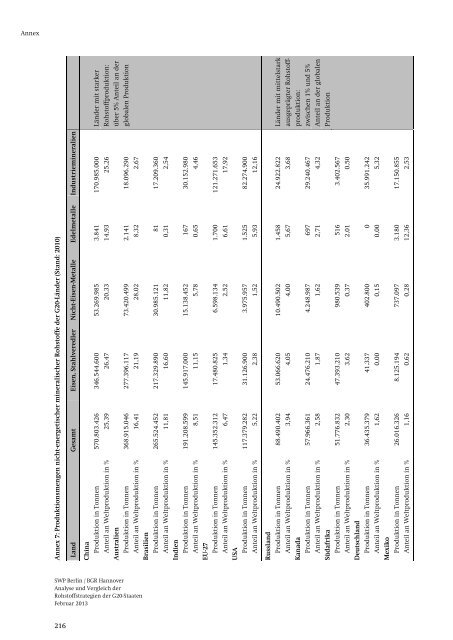
Annex 7: Produktionsmengen nicht-energetischer mineralischer Rohstoffe der G20-Länder (Stand: 2010)<br />
Land Gesamt Eisen, Stahlveredler Nicht-Eisen-Metalle Edelmetalle Industriemineralien<br />
China<br />
Produktion in Tonnen 570.803.426 346.544.600 53.269.985 3.841 170.985.000 Länder mit starker<br />
Anteil an Weltproduktion in % 25,39 26,47 20,33 14,93 25,26 Rohstoffproduktion:<br />
Australien über 5% Anteil an der<br />
Produktion in Tonnen 368.915.046 277.396.117 73.420.499 2.141 18.096.290 globalen Produktion<br />
Anteil an Weltproduktion in % 16,41 21,19 28,02 8,32 2,67<br />
Brasilien<br />
Produktion in Tonnen 265.524.452 217.329.890 30.985.121 81 17.209.360<br />
Anteil an Weltproduktion in % 11,81 16,60 11,82 0,31 2,54<br />
Indien<br />
Produktion in Tonnen 191.208.599 145.917.000 15.138.452 167 30.152.980<br />
Anteil an Weltproduktion in % 8,51 11,15 5,78 0,65 4,46<br />
EU-27<br />
Produktion in Tonnen 145.352.312 17.480.825 6.598.134 1.700 121.271.653<br />
Anteil an Weltproduktion in % 6,47 1,34 2,52 6,61 17,92<br />
USA<br />
Produktion in Tonnen 117.379.282 31.126.900 3.975.957 1.525 82.274.900<br />
Anteil an Weltproduktion in % 5,22 2,38 1,52 5,93 12,16<br />
Russland<br />
Produktion in Tonnen 88.490.402 53.066.620 10.490.502 1.458 24.922.822 Länder mit mittelstark<br />
Anteil an Weltproduktion in % 3,94 4,05 4,00 5,67 3,68 ausgeprägter Rohstoff-<br />
Kanada produktion:<br />
Produktion in Tonnen 57.966.361 24.476.210 4.248.987 697 29.240.467 zwischen 1% und 5%<br />
Anteil an Weltproduktion in % 2,58 1,87 1,62 2,71 4,32 Anteil an der globalen<br />
Südafrika Produktion<br />
Produktion in Tonnen 51.776.832 47.393.210 980.539 516 3.402.567<br />
Anteil an Weltproduktion in % 2,30 3,62 0,37 2,01 0,50<br />
Deutschland<br />
Produktion in Tonnen 36.435.379 41.337 402.800 0 35.991.242<br />
Anteil an Weltproduktion in % 1,62 0,00 0,15 0,00 5,32<br />
Mexiko<br />
Produktion in Tonnen 26.016.326 8.125.194 737.097 3.180 17.150.855<br />
Anteil an Weltproduktion in % 1,16 0,62 0,28 12,36 2,53<br />
SWP Berlin / BGR Hannover<br />
Analyse und Vergleich der<br />
Rohstoffstrategien der G20-Staaten<br />
Februar 2013<br />
216