Nationale Alleingänge oder internationale Kooperation? - Stiftung ...
Nationale Alleingänge oder internationale Kooperation? - Stiftung ...
Nationale Alleingänge oder internationale Kooperation? - Stiftung ...

Erfolgreiche ePaper selbst erstellen
Machen Sie aus Ihren PDF Publikationen ein blätterbares Flipbook mit unserer einzigartigen Google optimierten e-Paper Software.
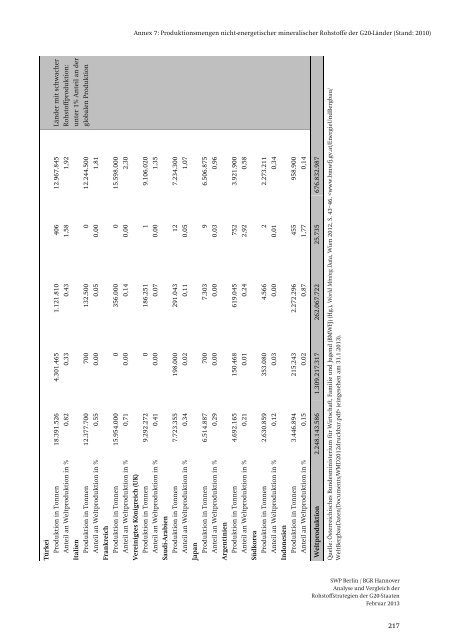
Annex 7: Produktionsmengen nicht-energetischer mineralischer Rohstoffe der G20-Länder (Stand: 2010)<br />
Türkei<br />
Produktion in Tonnen 18.391.526 4.301.465 1.121.810 406 12.967.845 Länder mit schwacher<br />
Anteil an Weltproduktion in % 0,82 0,33 0,43 1,58 1,92 Rohstoffproduktion:<br />
Italien unter 1% Anteil an der<br />
Produktion in Tonnen 12.377.700 700 132.500 0 12.244.500 globalen Produktion<br />
Anteil an Weltproduktion in % 0,55 0,00 0,05 0,00 1,81<br />
Frankreich<br />
Produktion in Tonnen 15.954.000 0 356.000 0 15.598.000<br />
Anteil an Weltproduktion in % 0,71 0,00 0,14 0,00 2,30<br />
Vereinigtes Königreich (UK)<br />
Produktion in Tonnen 9.292.272 0 186.251 1 9.106.020<br />
Anteil an Weltproduktion in % 0,41 0,00 0,07 0,00 1,35<br />
Saudi-Arabien<br />
Produktion in Tonnen 7.723.355 198.000 291.043 12 7.234.300<br />
Anteil an Weltproduktion in % 0,34 0,02 0,11 0,05 1,07<br />
Japan<br />
Produktion in Tonnen 6.514.887 700 7.303 9 6.506.875<br />
Anteil an Weltproduktion in % 0,29 0,00 0,00 0,03 0,96<br />
Argentinien<br />
Produktion in Tonnen 4.692.165 150.468 619.045 752 3.921.900<br />
Anteil an Weltproduktion in % 0,21 0,01 0,24 2,92 0,58<br />
Südkorea<br />
Produktion in Tonnen 2.630.859 353.080 4.566 2 2.273.211<br />
Anteil an Weltproduktion in % 0,12 0,03 0,00 0,01 0,34<br />
Indonesien<br />
Produktion in Tonnen 3.446.894 215.243 2.272.296 455 958.900<br />
Anteil an Weltproduktion in % 0,15 0,02 0,87 1,77 0,14<br />
Weltproduktion 2.248.143.586 1.309.217.317 262.067.722 25.735 676.832.987<br />
Quelle: Österreichisches Bundesministerium für Wirtschaft, Familie und Jugend (BMWFJ) (Hg.), World Mining Data, Wien 2012, S. 43–46, (eingesehen am 31.1.2013).<br />
SWP Berlin / BGR Hannover<br />
Analyse und Vergleich der<br />
Rohstoffstrategien der G20-Staaten<br />
Februar 2013<br />
217