Nationale Alleingänge oder internationale Kooperation? - Stiftung ...
Nationale Alleingänge oder internationale Kooperation? - Stiftung ...
Nationale Alleingänge oder internationale Kooperation? - Stiftung ...

Erfolgreiche ePaper selbst erstellen
Machen Sie aus Ihren PDF Publikationen ein blätterbares Flipbook mit unserer einzigartigen Google optimierten e-Paper Software.
Annex<br />
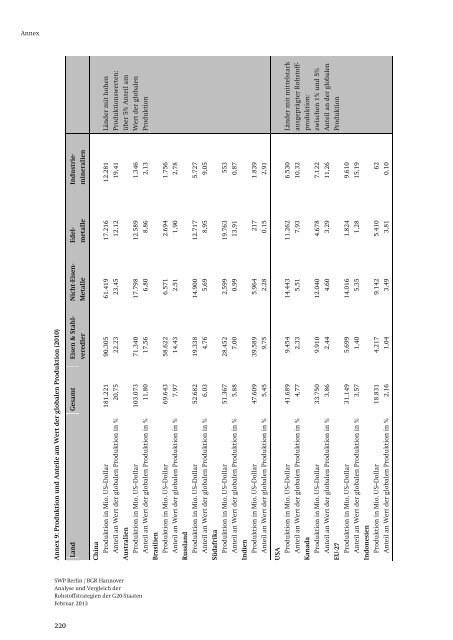
Annex 9: Produktion und Anteile am Wert der globalen Produktion (2010)<br />
Land Gesamt Eisen & Stahlveredler<br />
Nicht-Eisen-<br />
Metalle<br />
Edelmetalle<br />
Industriemineralien<br />
China<br />
Produktion in Mio. US--Dollar 181.221 90.305 61.419 17.216 12.281 Länder mit hohen<br />
Anteil an Wert der globalen Produktion in % 20,75 22,23 23,45 12,12 19,41 Produktionswerten:<br />
Australien über 5% Anteil am<br />
Produktion in Mio. US--Dollar 103.073 71.340 17.798 12.589 1.346 Wert der globalen<br />
Anteil an Wert der globalen Produktion in % 11,80 17,56 6,80 8,86 2,13 Produktion<br />
Brasilien<br />
Produktion in Mio. US--Dollar 69.643 58.622 6.571 2.694 1.756<br />
Anteil an Wert der globalen Produktion in % 7,97 14,43 2,51 1,90 2,78<br />
Russland<br />
Produktion in Mio. US--Dollar 52.682 19.338 14.900 12.717 5.727<br />
Anteil an Wert der globalen Produktion in % 6,03 4,76 5,69 8,95 9,05<br />
Südafrika<br />
Produktion in Mio. US--Dollar 51.367 28.452 2.599 19.763 553<br />
Anteil an Wert der globalen Produktion in % 5,88 7,00 0,99 13,91 0,87<br />
Indien<br />
Produktion in Mio. US--Dollar 47.609 39.589 5.964 217 1.839<br />
Anteil an Wert der globalen Produktion in % 5,45 9,75 2,28 0,15 2,91<br />
USA<br />
Produktion in Mio. US--Dollar 41.689 9.454 14.443 11.262 6.530 Länder mit mittelstark<br />
Anteil an Wert der globalen Produktion in % 4,77 2,33 5,51 7,93 10,32 ausgeprägter Rohstoff-<br />
Kanada produktion:<br />
Produktion in Mio. US--Dollar 33.750 9.910 12.040 4.678 7.122 zwischen 1% und 5%<br />
Anteil an Wert der globalen Produktion in % 3,86 2,44 4,60 3,29 11,26 Anteil an der globalen<br />
EU-27 Produktion<br />
Produktion in Mio. US--Dollar 31.149 5.699 14.016 1.824 9.610<br />
Anteil an Wert der globalen Produktion in % 3,57 1,40 5,35 1,28 15,19<br />
Indonesien<br />
Produktion in Mio. US--Dollar 18.831 4.217 9.142 5.410 62<br />
Anteil an Wert der globalen Produktion in % 2,16 1,04 3,49 3,81 0,10<br />
SWP Berlin / BGR Hannover<br />
Analyse und Vergleich der<br />
Rohstoffstrategien der G20-Staaten<br />
Februar 2013<br />
220