- Page 1:
Department of Energy FY 2012 Congre
- Page 6 and 7:
Page 2
- Page 8 and 9:
Page 4
- Page 10 and 11:
Outyear Appropriation Summary NNSA
- Page 12 and 13:
FY 2011 President’s Request level
- Page 14 and 15:
NNSA Summary by Appropriation FY 20
- Page 16 and 17:
Indirect Costs and Other Items of I
- Page 18 and 19:
Other Indirect Cost Projections Fac
- Page 20 and 21:
minimizing the impact to mission. C
- Page 22 and 23:
Page 18
- Page 24 and 25:
Page 20
- Page 26 and 27:
Much of the nation’s nuclear expe
- Page 28 and 29:
Office of the Administrator Office
- Page 30 and 31:
Office of the Administrator/ Progra
- Page 32 and 33:
Office of the Administrator/ Progra
- Page 34 and 35:
Office of the Administrator/ Progra
- Page 36 and 37:
Office of the Administrator/ Progra
- Page 38 and 39:
Office of the Administrator/ Progra
- Page 40 and 41:
Congressionally Directed Projects F
- Page 42 and 43:
Page 38
- Page 44 and 45:
Page 40
- Page 46 and 47:
Page 42
- Page 48 and 49:
Page 44
- Page 50 and 51:
Outyear Appropriation Summary by Pr
- Page 52 and 53:
Mission The Weapons Activities appr
- Page 54 and 55:
to identifying and responding to po
- Page 56 and 57:
including securing dangerous nuclea
- Page 58 and 59:
granularity of the costs required t
- Page 60 and 61:
Department of Energy (DOE) Working
- Page 62 and 63:
Outyear Funding Profile by Subprogr
- Page 64 and 65:
Benefits The DSW’s four subprogra
- Page 66 and 67:
Weapons Dismantlement and Dispositi
- Page 68 and 69:
FY 2010 Actual FY 2011 FY 2012 Appr
- Page 70 and 71:
FY 2010 Actual FY 2011 FY 2012 Appr
- Page 72 and 73:
FY 2010 Actual FY 2011 FY 2012 Appr
- Page 74 and 75:
FY 2010 Actual FY 2011 Approp Reque
- Page 76 and 77:
FY 2010 Actual FY 2011 FY 2012 Appr
- Page 78 and 79:
FY 2010 Actual FY 2011 FY 2012 Appr
- Page 80 and 81:
Stockpile Systems B61 Stockpile Sy
- Page 82 and 83:
Stockpile Services Production Supp
- Page 84 and 85:
Major Item of Equipment Major Items
- Page 86 and 87:
conditions and in extreme environme
- Page 88 and 89:
FY 2010 Accomplishments Advanced Ce
- Page 90 and 91:
The Science Campaign is planning fu
- Page 92 and 93:
(dollars in thousands) FY 2010 Actu
- Page 94 and 95:
(dollars in thousands) FY 2010 Actu
- Page 96 and 97:
Capital Operating Expenses and Cons
- Page 98 and 99:
unauthorized use) are achieved and
- Page 100 and 101:
• Successfully completed and test
- Page 102 and 103:
Detailed Justification (dollars in
- Page 104 and 105:
(dollars in thousands) FY 2010 Actu
- Page 106 and 107:
Explanation of Funding Changes FY 2
- Page 108 and 109:
Page 104
- Page 110 and 111:
Campaign and a major goal for Natio
- Page 112 and 113:
early FY 2012. Experiments that var
- Page 114 and 115:
with 1 MJ of laser energy imploding
- Page 116 and 117:
• Met the requirement for January
- Page 118 and 119:
Detailed Justification (dollars in
- Page 120 and 121:
FY 2010 Actual Approp (dollars in t
- Page 122 and 123:
Ignition Explanation of Funding Cha
- Page 124 and 125:
Page 120
- Page 126 and 127:
Benefits The ASC Campaign is compri
- Page 128 and 129:
LANL and SNL. Cielo will be more th
- Page 130 and 131:
(dollars in thousands) FY 2010 Actu
- Page 132 and 133:
(dollars in thousands) FY 2010 Actu
- Page 134 and 135:
Explanation of Funding Changes FY 2
- Page 136 and 137:
Page 132
- Page 138 and 139:
The Readiness Campaign capabilities
- Page 140 and 141:
• Rapid Design Commercial, off-th
- Page 142 and 143:
(dollars in thousands) FY 2010 Actu
- Page 144 and 145:
Stockpile Readiness Explanation of
- Page 146 and 147:
Page 142
- Page 148 and 149:
• Operate and maintain the nuclea
- Page 150 and 151:
• Repaired, in collaboration with
- Page 152 and 153:
(dollars in thousands) FY 2010 Actu
- Page 154 and 155:
(dollars in thousands) FY 2010 Actu
- Page 156 and 157:
(dollars in thousands) FY 2010 Actu
- Page 158 and 159:
(dollars in thousands) FY 2010 Actu
- Page 160 and 161:
(dollars in thousands) FY 2010 Actu
- Page 162 and 163:
Operations of Facilities Kansas Ci
- Page 164 and 165:
Material Recycle and Recovery FY 20
- Page 166 and 167:
Capital Operating Expenses and Cons
- Page 168 and 169:
07-D-220, Radioactive Liquid Waste
- Page 170 and 171:
Page 166
- Page 172 and 173:
Phase A: Infrastructure and Site Im
- Page 174 and 175:
(dollars in thousands) App ropriati
- Page 176 and 177:
Current Total Estimate (dollars in
- Page 178 and 179:
Page 174
- Page 180 and 181:
2. Design, Construction, and D&D Sc
- Page 182 and 183:
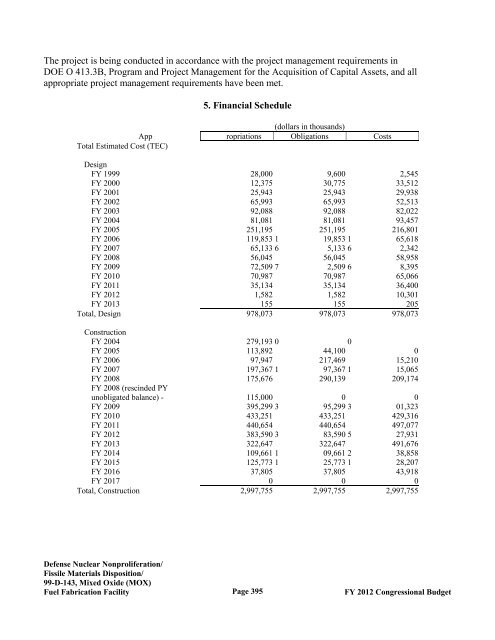
The project is being conducted in a
- Page 184 and 185:
5. Financial Schedule (dollars in t
- Page 186 and 187:
Total Estimated Cost (TEC) 6. Detai
- Page 188 and 189:
Page 184
- Page 190 and 191:
Project Description 4. Project Desc
- Page 192 and 193:
Total Estimated Cost (TEC) 5. Finan
- Page 194 and 195:
Total Estimated Cost (TEC) 6. Detai
- Page 196 and 197:
Page 192
- Page 198 and 199:
3. Baseline and Validation Status T
- Page 200 and 201:
Tunnel, and d) perform minor target
- Page 202 and 203:
(dollars in thousands) App ropriati
- Page 204 and 205:
9. Required D&D Information D&D Inf
- Page 206 and 207:
3. Baseline and Validation Status T
- Page 208 and 209:
Other Project Cost (OPC) (dollars i
- Page 210 and 211:
Current Total Estimate (dollars in
- Page 212 and 213:
Page 208
- Page 214 and 215:
3. Baseline and Validation Status T
- Page 216 and 217:
will undergo a phased closure, cons
- Page 218 and 219:
Total Estimated Cost (TEC) 6. Detai
- Page 220 and 221:
Page 216
- Page 222 and 223:
2. Design, Construction, and D&D Sc
- Page 224 and 225:
A Fire Water tie-in line to the HEU
- Page 226 and 227:
6. Details of Project Cost Estimate
- Page 228 and 229:
and available for demolition since
- Page 230 and 231:
NNSA’s increased emphasis on proj
- Page 232 and 233:
Nuclear Facility (dollars in thousa
- Page 234 and 235:
RLUOB Facility 5. Financial Schedul
- Page 236 and 237:
App ropriations (dollars in thousan
- Page 238 and 239:
(dollars in thousands) App ropriati
- Page 240 and 241:
App ropriations (dollars in thousan
- Page 242 and 243:
7. Schedule of Appropriation Reques
- Page 244 and 245:
Area Gross Square Feet (gsf) TA-55-
- Page 246 and 247:
transportation assets to meet shipp
- Page 248 and 249:
Secure Transportation Asset Operati
- Page 250 and 251:
(dollars in thousands) FY 2010 Actu
- Page 252 and 253:
Mission Capacity Explanation of Fun
- Page 254 and 255:
Secure Transportation Asset Program
- Page 256 and 257:
Salaries and Benefits Explanation o
- Page 258 and 259:
Investigation (FBI), and strengthen
- Page 260 and 261:
• Outreach activities continued w
- Page 262 and 263:
(dollars in thousands) FY 2010 Actu
- Page 264 and 265:
(dollars in thousands) FY 2010 Actu
- Page 266 and 267:
(dollars in thousands) FY 2010 Actu
- Page 268 and 269:
Nuclear Counterterrorism (Homeland
- Page 270 and 271:
Page 266
- Page 272 and 273:
FIRP is complementary to the ongoin
- Page 274 and 275:
Detailed Justification (dollars in
- Page 276 and 277:
Recapitalization Explanation of Fun
- Page 278 and 279:
Page 274
- Page 280 and 281:
Energy Modernization and Investment
- Page 282 and 283:
Detailed Justification (dollars in
- Page 284 and 285:
(dollars in thousands) FY 2010 Actu
- Page 286 and 287:
Capital Operating Expenses and Cons
- Page 288 and 289:
Estimates of Security Costs Recover
- Page 290 and 291:
Annual Performance Results and Targ
- Page 292 and 293:
Detailed Justification (dollars in
- Page 294 and 295:
(dollars in thousands) FY 2010 Actu
- Page 296 and 297:
Explanation of Funding Changes Oper
- Page 298 and 299:
Capital Operating Expenses and Cons
- Page 300 and 301:
2. Design, Construction, and D&D Sc
- Page 302 and 303:
(dollars in thousands) App ropriati
- Page 304 and 305:
7. Schedule of Appropriation Reques
- Page 306 and 307:
Page 302
- Page 308 and 309:
The entire NNSA workforce will reco
- Page 310 and 311:
Detailed Justification (dollars in
- Page 312 and 313:
Cyber Security (Homeland Security)
- Page 314 and 315:
Page 310
- Page 316 and 317:
This enterprise would help assure p
- Page 318 and 319:
(dollars in thousands) FY 2010 Actu
- Page 320 and 321:
Capital Operating Expenses and Cons
- Page 322 and 323:
Page 318
- Page 324 and 325:
Page 320
- Page 326 and 327:
Page 322
- Page 328 and 329:
Page 324
- Page 330 and 331:
FY 2010 Appropriation FY 2010 Budge
- Page 332 and 333:
FY 2010 FY 2011 FY 2012 FY 2013 FY
- Page 334 and 335:
The Nuclear Detonation Detection (N
- Page 336 and 337:
Detailed Justification (dollars in
- Page 338 and 339:
(dollars in thousands) FY 2010 Actu
- Page 340 and 341:
Capital Operating Expenses and Cons
- Page 342 and 343:
The Nuclear Safeguards and Security
- Page 344 and 345:
• Engaged thousands of technical
- Page 346 and 347:
Subprogram Subprogram Activity FY 2
- Page 348 and 349: FY 2010 Actual Approp (dollars in t
- Page 350 and 351: FY 2010 Actual Approp (dollars in t
- Page 352 and 353: FY 2010 Actual Approp (dollars in t
- Page 354 and 355: FY 2010 Actual Approp (dollars in t
- Page 356 and 357: FY 2010 Actual Approp (dollars in t
- Page 358 and 359: Nuclear Safeguards and Security Exp
- Page 360 and 361: Page 356
- Page 362 and 363: In February 2005, the Bratislava In
- Page 364 and 365: Major Outyear Priorities and Assump
- Page 366 and 367: FY 2010 Actual Approp (dollars in t
- Page 368 and 369: FY 2010 Actual Approp (dollars in t
- Page 370 and 371: FY 2010 Actual Approp (dollars in t
- Page 372 and 373: Navy Complex Explanation of Funding
- Page 374 and 375: Page 370
- Page 376 and 377: Crosscutting and Technical Support
- Page 378 and 379: Explanation of Funding Changes Zhel
- Page 380 and 381: Page 376
- Page 382 and 383: Preparation (PuP) project into a si
- Page 384 and 385: Detailed Justification FY 2010 Actu
- Page 386 and 387: FY 2010 Actual Approp (dollars in t
- Page 388 and 389: FY 2010 Actual Approp (dollars in t
- Page 390 and 391: Explanation of Funding Changes U.S.
- Page 392 and 393: Capital Operating Expenses and Cons
- Page 394 and 395: Page 390
- Page 396 and 397: additional alternatives for disposi
- Page 400 and 401: (dollars in thousands) App ropriati
- Page 402 and 403: 6. Details of Project Cost Estimate
- Page 404 and 405: 9. Required D&D Information Area Sq
- Page 406 and 407: CD-0 a CD-1 2. Design, Construction
- Page 408 and 409: FY 2011 and FY 2012 Description of
- Page 410 and 411: (dollars in thousands) App ropriati
- Page 412 and 413: FY 2008 FY 2009 Performance Baselin
- Page 414 and 415: Page 410
- Page 416 and 417: Review Team (IRT), comprised of sub
- Page 418 and 419: 4. Project Description, Justificati
- Page 420 and 421: 5. Financial Schedule (dollars in t
- Page 422 and 423: (dollars in thousands) App ropriati
- Page 424 and 425: 8. Related Operations and Maintenan
- Page 426 and 427: Outyear Funding Profile by Subprogr
- Page 428 and 429: vital to GTRI’s mission because i
- Page 430 and 431: FY 2010 Actual Approp (dollars in t
- Page 432 and 433: FY 2010 Actual Approp (dollars in t
- Page 434 and 435: Capital Operating Expenses and Cons
- Page 436 and 437: Page 432
- Page 438 and 439: Page 434
- Page 440 and 441: Page 436
- Page 442 and 443: FY 2010 Budget Execution PY Balance
- Page 444 and 445: affect the operational availability
- Page 446 and 447: Major Outyear Priorities and Assump
- Page 448 and 449:
Detailed Justification FY 2010 Actu
- Page 450 and 451:
FY 2010 Actual Approp (dollars in t
- Page 452 and 453:
FY 2010 Actual Approp (dollars in t
- Page 454 and 455:
(dollars in thousands) FY 2010 Actu
- Page 456 and 457:
FY 2010 Actual Approp (dollars in t
- Page 458 and 459:
FY 2010 Actual Approp (dollars in t
- Page 460 and 461:
FY 2010 Actual Approp (dollars in t
- Page 462 and 463:
Explanation of Funding Changes FY 2
- Page 464 and 465:
Detailed Justification (dollars in
- Page 466 and 467:
Capital Operating Expenses and Cons
- Page 468 and 469:
Major Items of Equipment (MIE) (TEC
- Page 470 and 471:
The project is being conducted in a
- Page 472 and 473:
Other Project Cost (OPC) Current To
- Page 474 and 475:
Page 470
- Page 476 and 477:
security systems requires upgrading
- Page 478 and 479:
Not applicable for PED. 10. Acquisi
- Page 480 and 481:
4. Project Description, Justificati
- Page 482 and 483:
(dollars in thousands) App ropriati
- Page 484 and 485:
9. Required D&D Information Area Sq
- Page 486 and 487:
FY 2010 Actual Appropriation FY 201
- Page 488 and 489:
ACTIVITIES: Naval Reactors The broa
- Page 490 and 491:
OUT-YEAR FUNDING: (dollars in thous
- Page 492 and 493:
Readiness in Technical Base and Fac
- Page 494 and 495:
FUNDING BY PROGRAM: KNOLLS ATOMIC P
- Page 496 and 497:
FUNDING BY PROGRAM: LAWRENCE LIVERM
- Page 498 and 499:
INTRODUCTION: Site Description The
- Page 500 and 501:
Engineering Campaign The Engineerin
- Page 502 and 503:
or nuclear materials in the U.S. or
- Page 504 and 505:
addition, LLNL assists technical an
- Page 506 and 507:
OUT-YEAR FUNDING: (dollars in thous
- Page 508 and 509:
• Advanced Certification: Advance
- Page 510 and 511:
Advanced Simulation and Computing (
- Page 512 and 513:
focus on improving the efficiency o
- Page 514 and 515:
FUNDING BY PROGRAM: NEVADA NATIONAL
- Page 516 and 517:
NNSA Office of Defense Programs and
- Page 518 and 519:
Site Stewardship In FY 2012, Site S
- Page 520 and 521:
OUT-YEAR FUNDING: (dollars in thous
- Page 522 and 523:
the past three years, this strategy
- Page 524 and 525:
FUNDING BY PROGRAM: SANDIA NATIONAL
- Page 526 and 527:
Sandia also conducts operations at
- Page 528 and 529:
Inertial Confinement Fusion Ignitio
- Page 530 and 531:
Site Stewardship Long Term Stewards
- Page 532 and 533:
supports the removal and disposal o
- Page 534 and 535:
OUT-YEAR FUNDING: (dollars in thous
- Page 536 and 537:
Facilities include facilities manag
- Page 538 and 539:
at several Russian Enterprises. The
- Page 540 and 541:
OUT-YEAR FUNDING: (dollars in thous
- Page 542 and 543:
highly enriched uranium (HEU) and o
- Page 544 and 545:
security program, and an alignment
- Page 546 and 547:
INTRODUCTION: Site Description The
- Page 548 and 549:
FUNDING BY PROGRAM: BROOKHAVEN NATI
- Page 550 and 551:
FUNDING BY PROGRAM: Chicago Operati
- Page 552 and 553:
Congressional Items of Interest: Th
- Page 554 and 555:
FUNDING BY PROGRAM: OAK RIDGE NATIO
- Page 556 and 557:
applications, and tracks global mac
- Page 558 and 559:
FUNDING BY PROGRAM: PACIFIC NORTHWE
- Page 560 and 561:
development mission. The PNNL also
- Page 562:
Page 558