- Page 1 and 2: DOCUMENT DE RÉFÉRENCE 2008COLLECT
- Page 4 and 5: TABLE DES MATIÈRESTABLE DES MATIÈ
- Page 6 and 7: Document de référence 2008CHAPITR
- Page 8 and 9: PERSONNES RESPONSABLES DU DOCUMENT
- Page 10 and 11: CONTROLEURS LEGAUX DES COMPTES 2Doc
- Page 12 and 13: INFORMATIONS FINANCIERES SELECTIONN
- Page 14 and 15: FACTEURS DE RISQUES 4Document de r
- Page 17 and 18: 4FACTEURS DE RISQUESLa découverte
- Page 19 and 20: 4FACTEURS DE RISQUESUne éventuelle
- Page 21 and 22: 4FACTEURS DE RISQUESAujourd’hui,
- Page 23 and 24: 4FACTEURS DE RISQUESAssurances de r
- Page 25 and 26: 5INFORMATIONS CONCERNANT L’ÉMETT
- Page 27 and 28: 6APERÇU DES ACTIVITÉSCHAPITRE 6 :
- Page 29 and 30: 6APERÇU DES ACTIVITÉSEn 2008, en
- Page 31 and 32: 6APERÇU DES ACTIVITÉS tirer profi
- Page 33 and 34: 6APERÇU DES ACTIVITÉSEn dépit d
- Page 35 and 36: 6APERÇU DES ACTIVITÉSLe graphique
- Page 37 and 38: 6APERÇU DES ACTIVITÉSLe graphique
- Page 39 and 40: 6APERÇU DES ACTIVITÉSLe graphique
- Page 41 and 42: 6APERÇU DES ACTIVITÉSMarché de l
- Page 43 and 44: 6APERÇU DES ACTIVITÉSLe tableau s
- Page 45 and 46: 6APERÇU DES ACTIVITÉSCe partenari
- Page 47 and 48: 6APERÇU DES ACTIVITÉSLe tableau s
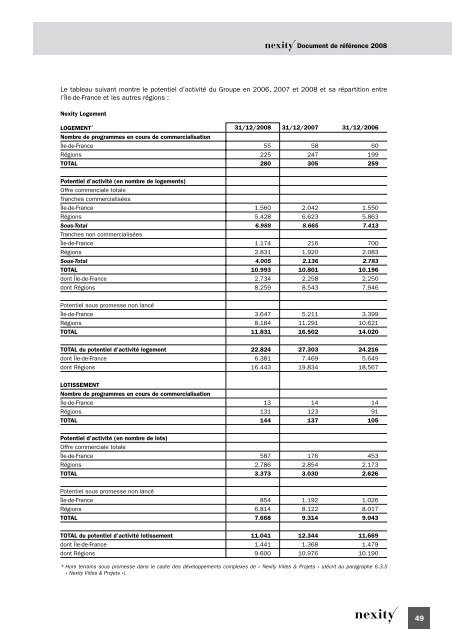
- Page 49: 6APERÇU DES ACTIVITÉSActivité à
- Page 53 and 54: 6APERÇU DES ACTIVITÉSLa filiale s
- Page 55 and 56: 6APERÇU DES ACTIVITÉS6.3.1.7 Comm
- Page 57 and 58: 6APERÇU DES ACTIVITÉSforme de soc
- Page 59 and 60: 6APERÇU DES ACTIVITÉS6.3.2.2 Stra
- Page 61 and 62: 6APERÇU DES ACTIVITÉSLa majeure p
- Page 63 and 64: 6APERÇU DES ACTIVITÉS6.3.2.6 Port
- Page 65 and 66: 6APERÇU DES ACTIVITÉSPortefeuille
- Page 67 and 68: 6APERÇU DES ACTIVITÉSPhase de mon
- Page 69 and 70: 6APERÇU DES ACTIVITÉS6.3.2.9 Orga
- Page 71 and 72: 6APERÇU DES ACTIVITÉS6.3.3 Servic
- Page 73 and 74: 6APERÇU DES ACTIVITÉSGérance loc
- Page 75 and 76: 6APERÇU DES ACTIVITÉS Résidences
- Page 77 and 78: 6APERÇU DES ACTIVITÉS les réside
- Page 79 and 80: 6APERÇU DES ACTIVITÉSArthur l’O
- Page 81 and 82: 6APERÇU DES ACTIVITÉSÀ ce jour,
- Page 83 and 84: 6APERÇU DES ACTIVITÉS6.3.6.2 Cilo
- Page 85 and 86: 6APERÇU DES ACTIVITÉSLe tableau s
- Page 87 and 88: 6APERÇU DES ACTIVITÉSPar ailleurs
- Page 89 and 90: 6APERÇU DES ACTIVITÉScartes, cett
- Page 91 and 92: 6APERÇU DES ACTIVITÉSLorsque le l
- Page 93 and 94: 6APERÇU DES ACTIVITÉSPour y parve
- Page 95 and 96: 6APERÇU DES ACTIVITÉSPar ailleurs
- Page 97 and 98: 6APERÇU DES ACTIVITÉS6.7.2.3 Resp
- Page 99 and 100: 7ORGANIGRAMMECHAPITRE 7 : ORGANIGRA
- Page 101 and 102:
8PROPRIÉTÉS IMMOBILIÈRESCHAPITRE
- Page 103 and 104:
9EXAMEN DE LA SITUATION FINANCIÈRE
- Page 105 and 106:
9EXAMEN DE LA SITUATION FINANCIÈRE
- Page 107 and 108:
9EXAMEN DE LA SITUATION FINANCIÈRE
- Page 109 and 110:
9EXAMEN DE LA SITUATION FINANCIÈRE
- Page 111 and 112:
9EXAMEN DE LA SITUATION FINANCIÈRE
- Page 113 and 114:
9EXAMEN DE LA SITUATION FINANCIÈRE
- Page 115 and 116:
9EXAMEN DE LA SITUATION FINANCIÈRE
- Page 117 and 118:
9EXAMEN DE LA SITUATION FINANCIÈRE
- Page 119 and 120:
9EXAMEN DE LA SITUATION FINANCIÈRE
- Page 121 and 122:
9EXAMEN DE LA SITUATION FINANCIÈRE
- Page 123 and 124:
9EXAMEN DE LA SITUATION FINANCIÈRE
- Page 125 and 126:
9EXAMEN DE LA SITUATION FINANCIÈRE
- Page 127 and 128:
9EXAMEN DE LA SITUATION FINANCIÈRE
- Page 129 and 130:
10TRÉSORERIE ET CAPITAUXL’évolu
- Page 131 and 132:
10TRÉSORERIE ET CAPITAUX des créd
- Page 133 and 134:
11RECHERCHE ET DÉVELOPPEMENT, PROP
- Page 135 and 136:
13PRÉVISIONS OU ESTIMATIONS DU BÉ
- Page 137 and 138:
14ORGANES D’ADMINISTRATION, DE DI
- Page 139 and 140:
14ORGANES D’ADMINISTRATION, DE DI
- Page 141 and 142:
14ORGANES D’ADMINISTRATION, DE DI
- Page 143 and 144:
14ORGANES D’ADMINISTRATION, DE DI
- Page 145 and 146:
14ORGANES D’ADMINISTRATION, DE DI
- Page 147 and 148:
14ORGANES D’ADMINISTRATION, DE DI
- Page 149 and 150:
14ORGANES D’ADMINISTRATION, DE DI
- Page 151 and 152:
14ORGANES D’ADMINISTRATION, DE DI
- Page 153 and 154:
14ORGANES D’ADMINISTRATION, DE DI
- Page 155 and 156:
15RÉMUNÉRATION ET AVANTAGES DES D
- Page 157 and 158:
15RÉMUNÉRATION ET AVANTAGES DES D
- Page 159 and 160:
16FONCTIONNEMENT DES ORGANES D’AD
- Page 161 and 162:
16FONCTIONNEMENT DES ORGANES D’AD
- Page 163 and 164:
16FONCTIONNEMENT DES ORGANES D’AD
- Page 165 and 166:
16FONCTIONNEMENT DES ORGANES D’AD
- Page 167 and 168:
17SALARIÉS - RESSOURCES HUMAINESLa
- Page 169 and 170:
17SALARIÉS - RESSOURCES HUMAINESR
- Page 171 and 172:
17SALARIÉS - RESSOURCES HUMAINESAu
- Page 173 and 174:
17SALARIÉS - RESSOURCES HUMAINESŒ
- Page 175 and 176:
17SALARIÉS - RESSOURCES HUMAINES17
- Page 177 and 178:
17SALARIÉS - RESSOURCES HUMAINESLe
- Page 179 and 180:
18PRINCIPAUX ACTIONNAIRESCHAPITRE 1
- Page 181 and 182:
19OPÉRATIONS AVEC DES APPARENTÉSC
- Page 183 and 184:
20INFORMATIONS FINANCIÈRES CONCERN
- Page 185 and 186:
21INFORMATIONS COMPLÉMENTAIRES CON
- Page 187 and 188:
21INFORMATIONS COMPLÉMENTAIRES CON
- Page 189 and 190:
21INFORMATIONS COMPLÉMENTAIRES CON
- Page 191 and 192:
21INFORMATIONS COMPLÉMENTAIRES CON
- Page 193 and 194:
22CONTRATS IMPORTANTSCHAPITRE 22 :
- Page 195 and 196:
23INFORMATIONS PROVENANT DE TIERS,D
- Page 197 and 198:
25INFORMATIONS SUR LES PARTICIPATIO
- Page 199 and 200:
ANNEXE 1ÉTATS FINANCIERS CONSOLID
- Page 201 and 202:
ANNEXE 1BILAN CONSOLIDE AU 31 DECEM
- Page 203 and 204:
ANNEXE 1TABLEAU DES FLUX DE TRESORE
- Page 205 and 206:
ANNEXE 1La présentation des compte
- Page 207 and 208:
ANNEXE 12.6 Immobilisations incorpo
- Page 209 and 210:
ANNEXE 12.13 Trésorerie et équiva
- Page 211 and 212:
ANNEXE 12.20 Options de vente accor
- Page 213 and 214:
ANNEXE 1Exercice 2008 Forme juridiq
- Page 215 and 216:
ANNEXE 14.2 Détail des acquisition
- Page 217 and 218:
ANNEXE 1 Le pôle TertiaireFormé p
- Page 219 and 220:
ANNEXE 1Exercice 2007 pro forma(en
- Page 221 and 222:
ANNEXE 1NOTES 7 - CHARGES EXTERNES
- Page 223 and 224:
ANNEXE 110.3 Preuve de l’ImpôtRa
- Page 225 and 226:
ANNEXE 113.2 Détail des mouvements
- Page 227 and 228:
ANNEXE 1Valeur nette des titres de
- Page 229 and 230:
ANNEXE 1NOTE 22 - CAPITAUX PROPRES
- Page 231 and 232:
ANNEXE 1Plan d’actions gratuitesL
- Page 233 and 234:
ANNEXE 1Détail par niveau de résu
- Page 235 and 236:
ANNEXE 1Autorisations et utilisatio
- Page 237 and 238:
ANNEXE 1Pôle TertiairePour le pôl
- Page 239 and 240:
ANNEXE 1Sensibilité au 31 décembr
- Page 241 and 242:
ANNEXE 1Des cautions professionnell
- Page 243 and 244:
ANNEXE 1NOTE 31 - AVANTAGES DU PERS
- Page 245 and 246:
ANNEXE 1NOTE 33 - INFORMATION RELAT
- Page 247 and 248:
ANNEXE 1 Cession de participationNe
- Page 249 and 250:
ANNEXE ADénomination sociale Clôt
- Page 251 and 252:
ANNEXE ADénomination sociale Clôt
- Page 253 and 254:
ANNEXE ADénomination sociale Clôt
- Page 255 and 256:
ANNEXE BDénomination sociale Clôt
- Page 257 and 258:
ANNEXE 1KPMG AUDIT1, cours Valmy929
- Page 259 and 260:
ANNEXE 2KPMG AUDIT1, cours Valmy929
- Page 261 and 262:
ANNEXE 2d. Avenants aux conventions
- Page 263 and 264:
ANNEXE 2II.CONVENTIONS CONCLUES AVE
- Page 265 and 266:
ANNEXE 2III.CONVENTION CONCLUE AVEC
- Page 267 and 268:
ANNEXE 2ModalitésDans le cadre de
- Page 269 and 270:
ANNEXE 2En fonction du niveau de r
- Page 271 and 272:
ANNEXE 2ModalitésLe Conseil d’ad
- Page 273 and 274:
ANNEXE 3Le Conseil d’administrati
- Page 275 and 276:
ANNEXE 31.3. Code de gouvernement d
- Page 277 and 278:
ANNEXE 31.6. Les censeursLe Conseil
- Page 279 and 280:
ANNEXE 3Le contrôle interne ne se
- Page 281 and 282:
ANNEXE 3Enfin, en promotion logemen
- Page 283 and 284:
ANNEXE 3Les contrats avec les tiers
- Page 285 and 286:
ANNEXE 3Le recensement des risques
- Page 287 and 288:
ANNEXE 3Enfin, parallèlement au pr
- Page 289 and 290:
ANNEXE 3KPMG AUDIT1, cours Valmy929
- Page 291 and 292:
ContactsDirection de la communicati