- Page 1 and 2:
COLOMBIA HOY Jorge Orlando Melo Obr
- Page 3 and 4:
Capítulo 5: Industrialización y p
- Page 5 and 6:
2 Releamos la tajante afirmación d
- Page 7 and 8:
4 y conservatizantes asociados al m
- Page 9 and 10:
6 en la confrontación, y las persp
- Page 11 and 12:
8 La dinámica que las ingentes gan
- Page 13 and 14:
1 Autores Luis Alberto Alvarez Mede
- Page 15 and 16:
3 Jorge Orlando Melo Medellín, 194
- Page 17 and 18:
1 Presentación Los autores que col
- Page 19 and 20:
3 como un país homogéneamente sub
- Page 21 and 22:
5 su contenido, se benefician de un
- Page 23 and 24:
2 análisis de esto tiene que parti
- Page 25 and 26:
4 Un punto central de esta evoluci
- Page 27 and 28:
6 provoca el descongelamiento acele
- Page 29 and 30:
2 españoles en México y el Perú
- Page 31 and 32:
4 Colombia no fue extraña a ella.
- Page 33 and 34:
6 anotar que en Antioquia se hallab
- Page 35 and 36:
8 de importación y exportación, q
- Page 37 and 38:
10 trabajos dirigidos por D’Elhuy
- Page 39 and 40:
12 Organizó colegios de enseñanza
- Page 41 and 42:
14 La vida social y las costumbres
- Page 43 and 44:
16 los gobiernos republicanos. La g
- Page 45 and 46:
18 sobre las instituciones básicas
- Page 47 and 48:
20 Melo. También era activa la nac
- Page 49 and 50:
22 fueron elegidos por votación po
- Page 51 and 52:
24 el mundo se pasea de lado a lado
- Page 53 and 54:
26 Colombia. Bogotá, 1970, 1974, 2
- Page 55 and 56:
2 conservadores y sobre la iglesia,
- Page 57 and 58:
4 colonización antioqueña, que en
- Page 59 and 60:
6 II. La guerra, la paz y las const
- Page 61 and 62:
8 una restringida clase dirigente,
- Page 63 and 64:
10 Así, en agosto de 1899 se lanza
- Page 65 and 66:
12 Sin embargo, alrededor del presi
- Page 67 and 68:
14 La Asamblea constituyente eligi
- Page 69 and 70:
16 pobres; entretanto su acción co
- Page 71 and 72:
18 anteriores y se suponía que ocu
- Page 73 and 74:
20 CUADRO 2 VOLUMEN Y VALOR DE LAS
- Page 75 and 76:
22 camino a las exportaciones: la r
- Page 77 and 78:
24 Se alegó en esa época que el r
- Page 79 and 80:
26 proporción de la población, em
- Page 81 and 82:
28 derecho de huelga, controles de
- Page 83 and 84:
30 de dólares y continuaron presta
- Page 85 and 86:
32 en la que pedían alzas en los s
- Page 87 and 88:
34 permanente de los gobiernos cons
- Page 89 and 90:
1 Capítulo 3 Colombia: Siglo y Med
- Page 91 and 92:
3 Frente Nacional, como tanto otros
- Page 93 and 94:
5 serie de conflictos agrarios, y d
- Page 95 and 96:
7 “Abolición de la esclavitud; l
- Page 97 and 98:
9 tierras a los indígenas, obligab
- Page 99 and 100:
11 miembros de unas pocas familias:
- Page 101 and 102:
13 nacional, y se suprimieron los g
- Page 103 and 104:
15 dispuso la desamortización de b
- Page 105 and 106:
17 El período radical presenció u
- Page 107 and 108:
19 tenía un hondo contenido polít
- Page 109 and 110:
21 edad y capital. La guerra que du
- Page 111 and 112:
23 norteamericano. Mientras tanto s
- Page 113 and 114:
25 agrarias que luchaban por mejore
- Page 115 and 116:
27 opositor del conservatismo desun
- Page 117 and 118:
29 democracia y bien intencionado b
- Page 119 and 120:
31 una refriega indecisa entre la a
- Page 121 and 122:
33 también fue motejada de sociali
- Page 123 and 124:
35 peticiones obreras sin excitaci
- Page 125 and 126:
37 Al mismo tiempo que el régimen
- Page 127 and 128:
39 insistieron en ella con la erró
- Page 129 and 130:
41 Oposición de derecha La oposici
- Page 131 and 132:
43 tarea de colocar nuevamente a Al
- Page 133 and 134:
45 del liberal Gabriel Turbay con 4
- Page 135 and 136:
47 duramente al sector trabajador.
- Page 137 and 138:
49 uno Ministro de Defensa; 29 por
- Page 139 and 140:
51 violencias contra el pueblo libe
- Page 141 and 142:
53 ante el vacío político que lo
- Page 143 and 144:
55 Los Programas del Conservatismo.
- Page 145 and 146:
1 Capítulo 4 Síntesis de Historia
- Page 147 and 148:
3 a su turno en un régimen agrario
- Page 149 and 150:
5 ideólogo Laureano Gómez, como e
- Page 151 and 152:
7 propagación de las guerrillas, h
- Page 153 and 154:
9 correspondió a Lleras quebrar de
- Page 155 and 156:
11 Hacia 1957, cuando fue pactado e
- Page 157 and 158:
13 condiciones de pacto frentenacio
- Page 159 and 160:
15 en una corriente minoritaria que
- Page 161 and 162:
17 identificarse. Ante la consagrac
- Page 163 and 164:
19 parecida a la de Pastrana, impor
- Page 165 and 166:
21 La sociedad colombiana es una so
- Page 167 and 168:
23 8 Bejarano, Jesús Antonio. El f
- Page 169 and 170:
2 manufacturas extranjeras, como la
- Page 171 and 172:
4 colombiana durante la década del
- Page 173 and 174:
6 por la industria al mismo ritmo d
- Page 175 and 176:
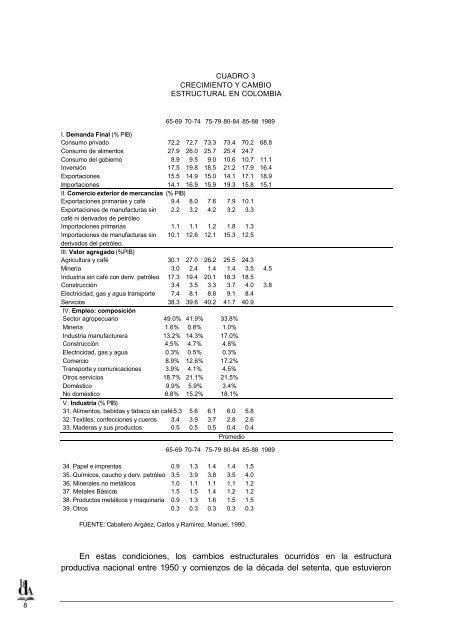
8 Quedaba planteado así, en este d
- Page 177 and 178:
10 Desde luego, son muchos los aspe
- Page 179 and 180:
12 descartar su acción sobre otras
- Page 181 and 182:
14 la población consumidora de la
- Page 183 and 184:
16 esperada. Este sistema permitió
- Page 185 and 186:
18 porcentaje en el cual el mayor p
- Page 187 and 188:
20 En tal sentido, las condiciones
- Page 189 and 190:
22 en el que se concentrará, como
- Page 191 and 192:
24 década del sesenta, empezaba a
- Page 193 and 194:
26 mecanismos de indemnización, to
- Page 195 and 196:
28 refleje en presiones sindicales
- Page 197 and 198:
30 Sin duda, el elemento más desta
- Page 199 and 200:
32 la formación de capital, fortal
- Page 201 and 202:
1 Capítulo 6 El Desarrollo Histór
- Page 203 and 204:
3 En relación con la propia econom
- Page 205 and 206:
5 balanza de pagos a partir de 1969
- Page 207 and 208:
7 En primer término, una economía
- Page 209 and 210:
9 aumentar la productividad, ya que
- Page 211 and 212:
11 más por el auge de las obras p
- Page 213 and 214:
13 cuando toda la clase dominante s
- Page 215 and 216:
15 curiosamente con la teoría radi
- Page 217 and 218:
17 la propiedad de las parcelas de
- Page 219 and 220:
19 insurreccional de múltiples reg
- Page 221 and 222:
21 llanos orientales y los de las z
- Page 223 and 224:
23 de que ésta culmina. El inmenso
- Page 225 and 226:
25 Nacional que, a la vez que estab
- Page 227 and 228:
27 pasados. Los grandes propietario
- Page 229 and 230:
29 de la región del Sumapaz, el Pa
- Page 231 and 232:
31 victoriosamente por el movimient
- Page 233 and 234:
33 sustancialmente durante los año
- Page 235 and 236:
35 afluencia de divisas propiciadas
- Page 237 and 238:
37 posiblemente menores, y un recur
- Page 239 and 240:
39 HIRSCHMAN, Albert, Estudios sobr
- Page 241 and 242:
2 como las de la “Fundación Gube
- Page 243 and 244:
4 Desde el propio miedo que la poes
- Page 245 and 246:
6 Igual sucedía con Darío Jaramil
- Page 247 and 248:
8 entendida como profesionalmente f
- Page 249 and 250:
10 (De El viento en el puente, p. 3
- Page 251 and 252:
12 que constituyen su educación se
- Page 253 and 254:
14 Hinojosa (1986) de Próspero Mor
- Page 255 and 256:
16 rencorosa, torva, de muchedumbre
- Page 257 and 258:
18 maniobras cubren el período que
- Page 259 and 260:
20 Eduardo García Aguilar a Evelio
- Page 261 and 262:
22 Moreno, Roberto Burgos Cantor, G
- Page 263 and 264:
1 Capítulo 8 El Teatro: Las últim
- Page 265 and 266:
3 Entre los distintos profesores ex
- Page 267 and 268:
5 Con posterioridad a los festivale
- Page 269 and 270:
7 diversas ciudades del continente
- Page 271 and 272:
9 autores, como Henry Díaz o Víct
- Page 273 and 274:
11 Brecht, sobre el nazismo en Alem
- Page 275 and 276:
13 Nota bibliográfica ANTEI, Giorg
- Page 277 and 278:
1 Capítulo 9 El Cine en la última
- Page 279 and 280:
3 internacionales. El encarcelamien
- Page 281 and 282:
5 sí alentadora y con cualidades h
- Page 283 and 284:
7 colombianos debe ser impulsado, s
- Page 285 and 286:
9 difíciles de controlar adecuadam
- Page 287 and 288:
11 Nacional de Colombia 1989. Estas
- Page 289 and 290:
2 los demás sectores de la econom
- Page 291 and 292:
4 tuvo la oportunidad de conocer el
- Page 293 and 294:
6 estimulante, salvo excepciones co
- Page 295 and 296:
8 Empero, si la aparición de esas
- Page 297 and 298:
10 Sin duda, hay ahora una verdader
- Page 299 and 300:
12 Trabajo casi exhaustivo de la ac
- Page 301 and 302:
14 NEUTRO, razón y poesía, Bogot
- Page 303 and 304:
2 eso, el Estado llegó también co
- Page 305 and 306:
4 dictadura civil inspirada por Lau
- Page 307 and 308:
6 supremo de la sociedad. Se descon
- Page 309 and 310:
8 prebendas económicas y gremiales
- Page 311 and 312:
10 Michelsen (1974-1978), a quien l
- Page 313 and 314:
12 López se encontró con los efec
- Page 315 and 316:
14 3. El Estado que todos buscan La
- Page 317 and 318: 16 mayoritarios; un Estado que atie
- Page 319 and 320: 18 proviene del desborde violento d
- Page 321 and 322: 20 finalizado el mandato constituci
- Page 323 and 324: 22 hizo más notoria con el debilit
- Page 325 and 326: 24 ignorando que el modelo turbayis
- Page 327 and 328: 26 presidencialismo que es la encar
- Page 329 and 330: 28 personalizado las instituciones,
- Page 331 and 332: 30 tación de las variadas fuerzas
- Page 333 and 334: 32 sobre la violencia, Bogotá CERE
- Page 335 and 336: 34 82 Leal Buitrago. “Los militar
- Page 337 and 338: 36 proyecto inicial de gobierno y l
- Page 339 and 340: 38 de los altos precios o hacer men
- Page 341 and 342: 40 Análisis político. Esta revist
- Page 343 and 344: CUADRO 1 PRODUCTO INTERNO BRUTO POR
- Page 345 and 346: Los beneficios futuros de los desce
- Page 347 and 348: Indice Año PIB per capita Aumento
- Page 349 and 350: CUADRO 5 CALIDAD DE LA VIVIENDA EN
- Page 351 and 352: La evidencia internacional sobre de
- Page 353 and 354: CUADRO 8 MATRICULA ESCUELA PRIMARIA
- Page 355 and 356: 14 CUADRO 10 NIVELES DE EDUCACION D
- Page 357 and 358: 16 generados van a parar a la admin
- Page 359 and 360: 18 complementarias que la mayoría
- Page 361 and 362: 20 Insatisfechas —NBI— durante
- Page 363 and 364: 2 En la primera sección, se hace u
- Page 365 and 366: 4 notorio en los años sesenta y se
- Page 367: 6 B. 1975 - 1990: La pausa de las t
- Page 371 and 372: 10 C. Las fuentes del crecimiento i
- Page 373 and 374: 12 café desde mediados de 1975, di
- Page 375 and 376: 14 explica, por el lado de la ofert
- Page 377 and 378: 16 Entre tanto, los cambios vertigi
- Page 379 and 380: 18 mediante nuevos impuestos. De un
- Page 381 and 382: 20 CUADRO 8 TASA ANUAL PROMEDIO DE
- Page 383 and 384: 22 la actividad del narcotráfico,
- Page 385 and 386: 24 pocas regiones, en algunas activ
- Page 387 and 388: 26 A. La nueva estrategia de crecim
- Page 389 and 390: 28 “Colciencias” al Departament
- Page 391 and 392: 30 CUADRO 10 CRECIMIENTO Y CAMBIO E
- Page 393 and 394: 32 CUADRO 11 PARTICIPACION DEL CONS
- Page 395 and 396: 34 Esta tarea cobra aún mas urgenc
- Page 397 and 398: 36 3. Nueva dimensión de la interv
- Page 399 and 400: 38 En Colombia existen algunos sect
- Page 401 and 402: 40 actos terroristas contra la infr
- Page 403 and 404: 42 CEREC, 1984. BEJARANO, Jesús An
- Page 405 and 406: 44 Bogotá, 1987. Es uno de los má