Small Decentralized Hydropower Program National ... - Cd3wd.com
Small Decentralized Hydropower Program National ... - Cd3wd.com
Small Decentralized Hydropower Program National ... - Cd3wd.com

Create successful ePaper yourself
Turn your PDF publications into a flip-book with our unique Google optimized e-Paper software.
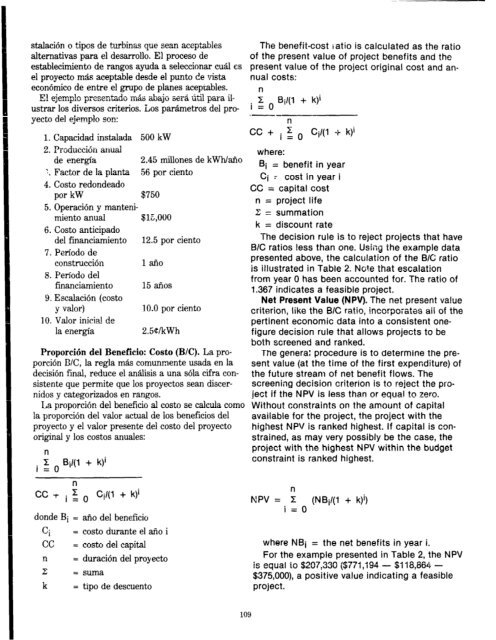
stalacion o tipos de turbinas que scan aceptables<br />
alternativas para el desarrollo. El proceso de<br />
establecimiento de ranges ayuda a seleccionar cual es<br />
el proyecto mas aceptable desde el punto de vista<br />
economico de entre el grupo de planes aceptables.<br />
E! ejepxplo pres~~r,f~&-j m&;i &jo ser& -&J pus Idi-<br />
ustrar 10s diversos criterios. Los par&metros de1 pro-<br />
ye&o de! ejemplo son:<br />
1. Capacidad instalada 500 kW<br />
2. pi-oJ-~cci&, all-uaj<br />
de energia 2.45 millones de kWh/aiio<br />
1. Factor de la planta 56 por ciento<br />
4. Costo redondeado<br />
por kW $750<br />
5. Operation y manteni-<br />
miento anual $lE,OOO<br />
6. Costo anticipado<br />
de1 financiamiento 12.5 por ciento<br />
7. Petiodo de<br />
construction 1 an0<br />
8. Periodo de1<br />
financiamiento 15 arias<br />
9. E scalacion (co&o<br />
y valor) 10.0 por ciento<br />
10. Valor initial de<br />
la energia 2.5UkWh<br />
Proporcih de1 Beneficio: Costo (B/C). La pro-<br />
portion G/C, la regla mas <strong>com</strong>unmente usada en la<br />
decision final, reduce el analisis a una sola cifra con-<br />
sistente que permite que 10s proyectos Sean discer-<br />
nidos y categorizados en rangos.<br />
La proportion de1 beneficio al costo se calcula <strong>com</strong>a<br />
la proporciom de1 valor actual de 10s beneficios de1<br />
proyecto y el valor presente de1 costo de1 proyecto<br />
original y 10s costos anuales:<br />
n<br />
i Z o Si/(l + k)i<br />
=<br />
n<br />
CC T i f 0 Ci/(l + k)t<br />
donde Bi = aiio de1 beneficio<br />
ci = cost0 durante el airo i<br />
cc = cost0 de1 capital<br />
n = duration de1 proy ecto<br />
z = suma<br />
k = tipo de descuento<br />
The benefit-cost ratio is calculated as the ratio<br />
of the present value of project benefits and the<br />
present value of the project original<br />
nual costs:<br />
n<br />
cost and anz<br />
i=O<br />
Bil(l + k)i<br />
.-<br />
n<br />
CC + i 2 0 Ci/(I + k)’<br />
where:<br />
R = benefit in year<br />
Ci : cost in year i<br />
cc = capital cost<br />
n = project life<br />
z = summation<br />
k = discount rate<br />
The decision rule is to reject projects that have<br />
B/C ratios less than one. Using the example data<br />
presented above, the calculation of the B/C ratio<br />
is illustrated in Table 2. Note that escalation<br />
from year 0 has been accounted for. The ratio of<br />
1.367 indicates a feasible project.<br />
Net Present Value (NPV). The net present va!ue<br />
criterion, like the B/C ratio, incorporates aii of the<br />
pertinent economic data into a consistent one-<br />
figure decision rule that allows projects to be<br />
both screened and ranked.<br />
The general procedure is to determine the pre-<br />
sent value (at the time of the first expenditure) of<br />
the future stream of net benefit flows. The<br />
screening decision criterion is to reject the pro-<br />
ject if the NFV is less than or equa! ?o zero.<br />
Without constraints on the amount of capital<br />
available for the project, the project with the<br />
highest NFV is ranked highest. If capital is con-<br />
strained, as may very possibly be the case, the<br />
project with the highest NFV within the budget<br />
constraint is ranked highest.<br />
n<br />
NFV= 1 (NBil(l + k)i)<br />
i=O<br />
109<br />
where NBi = the net benefits in year i.<br />
For the example presented in Table 2, the NFV<br />
is equal to $207,330 ($77;,;94 - $ii6,864 -<br />
$375,000), a positive value indicating a feasible<br />
project.

![Mum, int. [man] - Cd3wd.com](https://img.yumpu.com/51564724/1/190x134/mum-int-man-cd3wdcom.jpg?quality=85)