Small Decentralized Hydropower Program National ... - Cd3wd.com
Small Decentralized Hydropower Program National ... - Cd3wd.com
Small Decentralized Hydropower Program National ... - Cd3wd.com
Create successful ePaper yourself
Turn your PDF publications into a flip-book with our unique Google optimized e-Paper software.
Un problema muy corntin que 10s hidrologos confrontan<br />
cuando <strong>com</strong>ienzan un estudio regional es que<br />
las estaciones hidrometicas registraran periodos<br />
diferentes. Esto puede ser particularmente importante<br />
debido a que algunos de 10s calibradores<br />
pueden haber operado durante petiodos en que la<br />
cantidad de agL- 12 pra - abundante mientras que otros<br />
pueden haber registrado solo 10s periodos cuando la<br />
cantidad de agua era baja. Otros, aun, pueden haber<br />
traslapado ambos petiodos, de abundancia y escasez.<br />
Pretender utilizar estos datos simultineamente<br />
podria causar confusion y ma1 representar la<br />
situation real, Al .mismo tiempo, es importante que<br />
cualquier procedimiento que se use para llenar las<br />
brechas en la information no confunda aun mas la<br />
situation.<br />
Si uno no es lo suficientemente cuidadoso, se<br />
podtia crear un ambiente de falsa seguridad al intentar<br />
<strong>com</strong>pl+qr la information que falta. Primero, se<br />
debe tomal en cuenta que el uso de analisis de correlation<br />
y de regresion diluye el valor de !a informacibn..<br />
.La information utilizada para <strong>com</strong>pletar el<br />
vacio tiene que ser considerada solo <strong>com</strong>o una aproximacion<br />
de lo que realmente ocurrio. Ademas, si 10s<br />
datos van a ser utilizados en analisis estadisticos, el<br />
uso de regresion simple va a producir solo promedios<br />
m&mativnc vu* 11.. u ..“.a f-4, Ub 1-e .“U ..y&rcs ~l~scct&s. En txa! ,z;so, las<br />
variaciones naturales alrededor el promedio seran<br />
eliminadas, y por consiguiente la se disminuira la<br />
variacidn total. Se ha sugerido que cuando m&s de<br />
dos o tres puntos de information estin siendo<br />
rellenados, se anada al valor promedio determinado<br />
por la regresion un element0 al azar que est.4 basado<br />
en la variation inexplicada de la ecuacion regresional.<br />
Una excelente forma de empezar cualquier estudio<br />
en el que se vaya a utilizar la informacidn regional es<br />
representando graficamente la longitud de las series<br />
por medio de un diagrama de barras <strong>com</strong>a aparece<br />
en la Figura 1. De esta represent&on grafica es<br />
posible conceptualizar el perfodo optima al que toda<br />
la serie de datos puede relacionarse.<br />
Mas adelante en esta Section se describe un procedimiento<br />
para extender la base de 10s analisis<br />
relativos a la duration de corrientes. En este case<br />
son las caractetisticas de ias corrientes las que son<br />
extendidas en vez de las corrientes mismas.<br />
Se puede estimar aproximadamente el prornedio o<br />
la precipitation normal media& la ecuacion general<br />
N, = Nr ‘,<br />
donde,<br />
32<br />
diminished. It has been suggested that when<br />
more than two or three data points are being<br />
filled in, that a random eiement based on the<br />
unexplained variance of the regression equation<br />
be added to the mean value determined by the<br />
regression.<br />
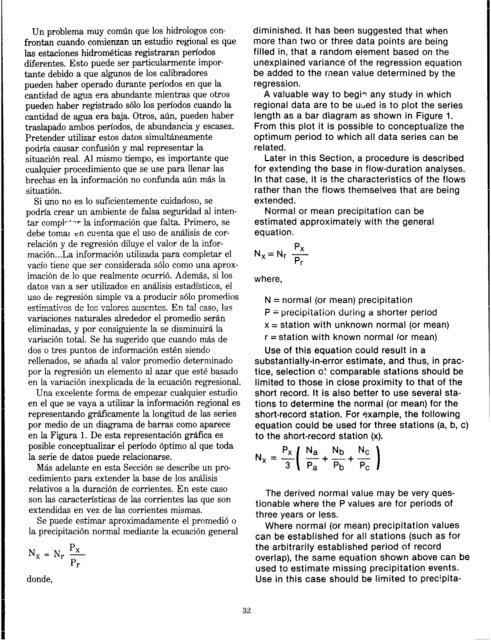
A valuable way to begin any study in which<br />
regional data are to be utied is to plot the series<br />
length as a bar diagram as shown in Figure 1.<br />
From this plot it is possible to conceptualize the<br />
optimum period to which all data series can be<br />
related.<br />
Later in this Section, a procedure is described<br />
for extending the base in flow-duration analyses.<br />
In that case, it is the characteristics of the flows<br />
rather than the flows themselves that are being<br />
extended.<br />
Normal or mean precipitation can be<br />
estimated approximately with the general<br />
equation.<br />
px<br />
Nx=Nr - PI<br />
where,<br />
N = normal (or mean) precipitation<br />
P = precipitation during a shorter period<br />
x = station with unknown normal (or mean)<br />
r = station with known normal (or mean)<br />
Use of this equation could result in a<br />
substantially-in-error estimate, and thus, in prac-<br />
tice, selection 0: <strong>com</strong>parable stations should be<br />
limited to those in close proximity to that of the<br />
short record. St is also better to use several sta-<br />
tions to determine the normal (or mean) for the<br />
short-record station. For example, the following<br />
equation could be used for three stations (a, b, c)<br />
to the short-record station (x).<br />
N, = ;<br />
1<br />
Na Nb NC<br />
-+-+-<br />
Pa Pb PC 1<br />
The derived normal value may be very ques-<br />
tionable where the P values are for periods of<br />
three years or less.<br />
Where normal (or mean) precipitation values<br />
can be established for all stations (such as for<br />
the arbitrarily established period of record<br />
overlap), the same equation shown above can be<br />
used to estimate missing precipitation events.<br />
Use in this case should be limited to precipita-


![Mum, int. [man] - Cd3wd.com](https://img.yumpu.com/51564724/1/190x134/mum-int-man-cd3wdcom.jpg?quality=85)
