Bericht über die menschliche Entwicklung 2006 - Human ...
Bericht über die menschliche Entwicklung 2006 - Human ...
Bericht über die menschliche Entwicklung 2006 - Human ...

Sie wollen auch ein ePaper? Erhöhen Sie die Reichweite Ihrer Titel.
YUMPU macht aus Druck-PDFs automatisch weboptimierte ePaper, die Google liebt.
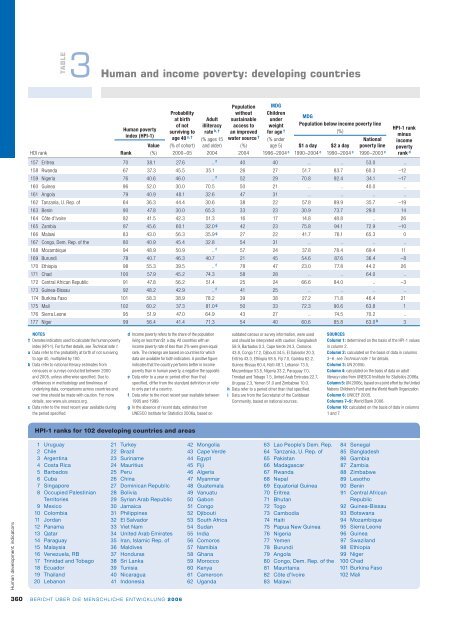
TABLE<br />
3<br />
<strong>Human</strong>andincomepoverty:developingcountries<br />
Probability<br />
at birth<br />
of not<br />
surviving to<br />
age 40 a, †<br />
(% of cohort)<br />
2000–05<br />
Adult<br />
illiteracy<br />
rate b, †<br />
(% ages 15<br />
and older)<br />
2004<br />
Population<br />
without<br />
sustainable<br />
access to<br />
an improved<br />
water source †<br />
MDG<br />
Children<br />
MDG<br />
under<br />
weight<br />
for age †<br />
(% under<br />
age 5)<br />
1996–2004 c<br />
Population below income poverty line<br />
(%)<br />
National<br />
1990–2004 c<br />
<strong>Human</strong> poverty<br />
index (HPI-1)<br />
HDI rank<br />
Rank (%)<br />
2004<br />
1990–2004 c 1990–2003 c<br />
Value<br />
(%)<br />
$1aday $2aday poverty line<br />
157 Eritrea 70 38.1 27.6 .. f 40 40 .. .. 53.0 ..<br />
158 Rwanda 67 37.3 45.5 35.1 26 27 51.7 83.7 60.3 –12<br />
159 Nigeria 76 40.6 46.0 .. f 52 29 70.8 92.4 34.1 –17<br />
160 Guinea 96 52.0 30.0 70.5 50 21 .. .. 40.0 ..<br />
161 Angola 79 40.9 48.1 32.6 47 31 .. .. .. ..<br />
162 Tanzania, U. Rep. of 64 36.3 44.4 30.6 38 22 57.8 89.9 35.7 –19<br />
163 Benin 90 47.8 30.0 65.3 33 23 30.9 73.7 29.0 14<br />
164 Côte d’Ivoire 82 41.5 42.3 51.3 16 17 14.8 48.8 .. 26<br />
165 Zambia 87 45.6 60.1 32.0 g 42 23 75.8 94.1 72.9 –10<br />
166 Malawi 83 43.0 56.3 35.9 g 27 22 41.7 76.1 65.3 0<br />
167 Congo, Dem. Rep. of the 80 40.9 45.4 32.8 54 31 .. .. .. ..<br />
168 Mozambique 94 48.9 50.9 .. f 57 24 37.8 78.4 69.4 11<br />
169 Burundi 78 40.7 46.3 40.7 21 45 54.6 87.6 36.4 –8<br />
170 Ethiopia 98 55.3 39.5 .. f 78 47 23.0 77.8 44.2 26<br />
171 Chad 100 57.9 45.2 74.3 58 28 .. .. 64.0 ..<br />
172 Central African Republic 91 47.8 56.2 51.4 25 24 66.6 84.0 .. –3<br />
173 Guinea-Bissau 92 48.2 42.9 .. f 41 25 .. .. .. ..<br />
174 Burkina Faso 101 58.3 38.9 78.2 39 38 27.2 71.8 46.4 21<br />
175 Mali 102 60.2 37.3 81.0 g 50 33 72.3 90.6 63.8 1<br />
176 Sierra Leone 95 51.9 47.0 64.9 43 27 .. 74.5 70.2 ..<br />
177 Niger 99 56.4 41.4 71.3 54 40 60.6 85.8 63.0 h 3<br />
HPI-1 rank<br />
minus<br />
income<br />
poverty<br />
rank d<br />
NOTES<br />
† Denotesindicatorsusedtocalculatethehumanpoverty<br />
index (HPI-1). For further details, see Technicalnote1.<br />
a Data refer to the probability at birth of not surviving<br />
to age 40, multiplied by 100.<br />
b Data refer to national literacy estimates from<br />
censuses or surveys conducted between 2000<br />
and 2005, unless otherwise specified. Due to<br />
differences in methodology and timeliness of<br />
underlying data, comparisons across countries and<br />
over time should be made with caution. For more<br />
details, see www.uis.unesco.org.<br />
c Data refer to the most recent year available during<br />
the period specified.<br />
d Incomepovertyreferstotheshareofthepopulation<br />
living on less than $1 a day. All countries with an<br />
income poverty rate of less than 2% were given equal<br />
rank. The rankings are based on countries for which<br />
data are available for both indicators. A positive figure<br />
indicatesthatthecountryperformsbetterinincome<br />
povertythaninhumanpoverty,anegativetheopposite.<br />
e Data refer to a year or period other than that<br />
specified, differ from the standard definition or refer<br />
to only part of a country.<br />
f Data refer to the most recent year available between<br />
1995 and 1999.<br />
g Intheabsenceofrecentdata,estimatesfrom<br />
UNESCO Institute for Statistics <strong>2006</strong>a, based on<br />
outdated census or survey information, were used<br />
and should be interpreted with caution: Bangladesh<br />
58.9,Barbados0.3,CapeVerde24.3,Comoros<br />
43.8, Congo 17.2, Djibouti 34.5, El Salvador 20.3,<br />
Eritrea43.3,Ethiopia58.5,Fiji7.0,Gambia62.2,<br />
Guinea-Bissau60.4,Haiti48.1,Lebanon13.5,<br />
Mozambique 53.5, Nigeria 33.2, Paraguay 7.0,<br />
Trinidad and Tobago 1.5, United Arab Emirates 22.7,<br />
Uruguay2.3,Yemen51.0andZimbabwe10.0.<br />
h Data refer to a period other than that specified.<br />
i Data are from the Secretariat of the Caribbean<br />
Community, based on national sources.<br />
SOURCES<br />
Column 1: determined on the basis of the HPI-1 values<br />
in column 2.<br />
Column 2: calculated on the basis of data in columns<br />
3–6; see Technical note 1 for details.<br />
Column 3: UN 2005b.<br />
Column 4: calculated on the basis of data on adult<br />
literacy rates from UNESCO Institute for Statistics <strong>2006</strong>a.<br />
Column 5: UN <strong>2006</strong>c, based on a joint effort by the United<br />
Nations Children’s Fund and the World Health Organization.<br />
Column 6: UNICEF 2005.<br />
Columns 7–9: World Bank <strong>2006</strong>.<br />
Column 10: calculated on the basis of data in columns<br />
1 and 7.<br />
HPI-1 ranks for 102 developing countries and areas<br />
<strong>Human</strong> development indicators<br />
1 Uruguay<br />
2 Chile<br />
3 Argentina<br />
4 Costa Rica<br />
5 Barbados<br />
6 Cuba<br />
7 Singapore<br />
8 Occupied Palestinian<br />
Territories<br />
9 Mexico<br />
10 Colombia<br />
11 Jordan<br />
12 Panama<br />
13 Qatar<br />
14 Paraguay<br />
15 Malaysia<br />
16 Venezuela, RB<br />
17 Trinidad and Tobago<br />
18 Ecuador<br />
19 Thailand<br />
20 Lebanon<br />
21 Turkey<br />
22 Brazil<br />
23 Suriname<br />
24 Mauritius<br />
25 Peru<br />
26 China<br />
27 Dominican Republic<br />
28 Bolivia<br />
29 Syrian Arab Republic<br />
30 Jamaica<br />
31 Philippines<br />
32 El Salvador<br />
33 Viet Nam<br />
34 United Arab Emirates<br />
35 Iran, Islamic Rep. of<br />
36 Maldives<br />
37 Honduras<br />
38 Sri Lanka<br />
39 Tunisia<br />
40 Nicaragua<br />
41 Indonesia<br />
42 Mongolia<br />
43 Cape Verde<br />
44 Egypt<br />
45 Fiji<br />
46 Algeria<br />
47 Myanmar<br />
48 Guatemala<br />
49 Vanuatu<br />
50 Gabon<br />
51 Congo<br />
52 Djibouti<br />
53 South Africa<br />
54 Sudan<br />
55 India<br />
56 Comoros<br />
57 Namibia<br />
58 Ghana<br />
59 Morocco<br />
60 Kenya<br />
61 Cameroon<br />
62 Uganda<br />
63 Lao People’s Dem. Rep.<br />
64 Tanzania, U. Rep. of<br />
65 Pakistan<br />
66 Madagascar<br />
67 Rwanda<br />
68 Nepal<br />
69 Equatorial Guinea<br />
70 Eritrea<br />
71 Bhutan<br />
72 Togo<br />
73 Cambodia<br />
74 Haiti<br />
75 Papua New Guinea<br />
76 Nigeria<br />
77 Yemen<br />
78 Burundi<br />
79 Angola<br />
80 Congo, Dem. Rep. of the<br />
81 Mauritania<br />
82 Côte d’Ivoire<br />
83 Malawi<br />
84 Senegal<br />
85 Bangladesh<br />
86 Gambia<br />
87 Zambia<br />
88 Zimbabwe<br />
89 Lesotho<br />
90 Benin<br />
91 Central African<br />
Republic<br />
92 Guinea-Bissau<br />
93 Botswana<br />
94 Mozambique<br />
95 Sierra Leone<br />
96 Guinea<br />
97 Swaziland<br />
98 Ethiopia<br />
99 Niger<br />
100 Chad<br />
101 Burkina Faso<br />
102 Mali<br />
360<br />
BERICHT ÜBER DIE MENSCHLICHE ENTWICKLUNG <strong>2006</strong>