Bericht über die menschliche Entwicklung 2006 - Human ...
Bericht über die menschliche Entwicklung 2006 - Human ...
Bericht über die menschliche Entwicklung 2006 - Human ...

Erfolgreiche ePaper selbst erstellen
Machen Sie aus Ihren PDF Publikationen ein blätterbares Flipbook mit unserer einzigartigen Google optimierten e-Paper Software.
TABLE<br />
26<br />
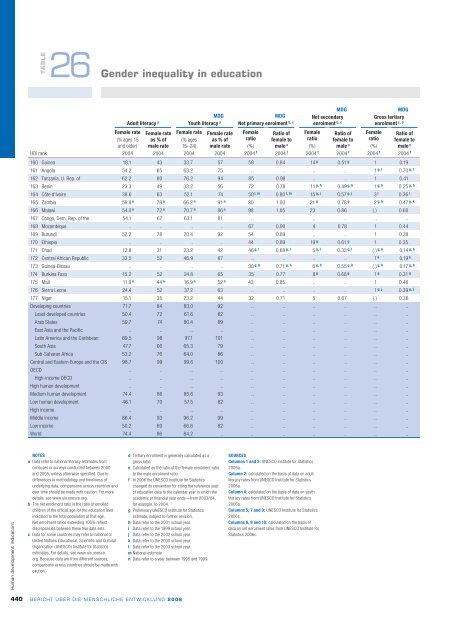
Gender inequality in education<br />
Adult literacy a<br />
MDG<br />
Youth literacy a<br />
MDG<br />
Net primary enrolment b, c<br />
MDG<br />
Net secondary<br />
enrolment b, c<br />
MDG<br />
Gross tertiary<br />
enrolment c, d<br />
Female rate Female rate Female rate Female rate Female Ratio of Female Ratio of Female Ratio of<br />
HDI rank<br />
2004 2004 2004 2004 2004 f 2004 f 2004 f 2004 f 2004 f 2004 f<br />
(% ages 15 as%of (% ages as%of ratio female to ratio female to ratio female to<br />
and older) male rate 15–24) male rate (%) male e (%) male e (%) male e<br />
160 Guinea 18.1 43 33.7 57 58 0.84 14 g 0.51 g 1 0.19<br />
161 Angola 54.2 65 63.2 75 .. .. .. .. 1 g, l 0.70 g, l<br />
162 Tanzania, U. Rep. of 62.2 80 76.2 94 85 0.98 .. .. 1 0.41<br />
163 Benin 23.3 49 33.2 56 72 0.78 11 g, h 0.49 g, h 1 g, h 0.25 g, h<br />
164 Côte d’Ivoire 38.6 63 52.1 74 50 l, m 0.80 l, m 15 g, j 0.57 g, j 3 i 0.36 i<br />
165 Zambia 59.8 n 78 n 66.2 n 91 n 80 1.00 21 g 0.78 g 2 g, k 0.47 g, k<br />
166 Malawi 54.0 n 72 n 70.7 n 86 n 98 1.05 23 0.86 (.) 0.60<br />
167 Congo, Dem. Rep. of the 54.1 67 63.1 81 .. .. .. .. .. ..<br />
168 Mozambique .. .. .. .. 67 0.90 4 0.78 1 0.44<br />
169 Burundi 52.2 78 70.4 92 54 0.89 .. .. 1 0.38<br />
170 Ethiopia .. .. .. .. 44 0.89 19 g 0.61 g 1 0.35<br />
171 Chad 12.8 31 23.2 42 46 g, l 0.68 g, l 5 g, l 0.33 g, l (.) g, h 0.14 g, h<br />
172 Central African Republic 33.5 52 46.9 67 .. .. .. .. 1 k 0.19 k<br />
173 Guinea-Bissau .. .. .. .. 38 g, h 0.71 g, h 6 g, h 0.55 g, h (.) g, h 0.17 g, h<br />
174 Burkina Faso 15.2 52 24.8 65 35 0.77 8 g 0.68 g 1 g 0.31 g<br />
175 Mali 11.9 n 44 n 16.9 n 52 n 43 0.85 .. .. 1 0.46<br />
176 Sierra Leone 24.4 52 37.2 63 .. .. .. .. 1 g, j 0.39 g, j<br />
177 Niger 15.1 35 23.2 44 32 0.71 5 0.67 (.) 0.36<br />
Developing countries 71.7 84 83.0 92 .. .. .. .. .. ..<br />
Least developed countries 50.4 72 61.6 82 .. .. .. .. .. ..<br />
Arab States 59.7 74 80.4 89 .. .. .. .. .. ..<br />
East Asia and the Pacific .. .. .. .. .. .. .. .. .. ..<br />
Latin America and the Caribbean 89.5 98 97.1 101 .. .. .. .. .. ..<br />
South Asia 47.7 66 65.3 79 .. .. .. .. .. ..<br />
Sub-Saharan Africa 53.2 76 64.0 86 .. .. .. .. .. ..<br />
Central and Eastern Europe and the CIS 98.7 99 99.6 100 .. .. .. .. .. ..<br />
OECD .. .. .. .. .. .. .. .. .. ..<br />
High-income OECD .. .. .. .. .. .. .. .. .. ..<br />
High human development .. .. .. .. .. .. .. .. .. ..<br />
Medium human development 74.4 86 85.6 93 .. .. .. .. .. ..<br />
Low human development 46.1 70 57.5 82 .. .. .. .. .. ..<br />
High income .. .. .. .. .. .. .. .. .. ..<br />
Middle income 86.4 93 96.2 99 .. .. .. .. .. ..<br />
Low income 50.2 69 66.6 82 .. .. .. .. .. ..<br />
World 74.4 86 84.2 .. .. .. .. .. .. ..<br />
<strong>Human</strong> development indicators<br />
NOTES<br />
a Data refer to national literacy estimates from<br />
censuses or surveys conducted between 2000<br />
and 2005, unless otherwise specified. Due to<br />
differences in methodology and timeliness of<br />
underlying data, comparisons across countries and<br />
over time should be made with caution. For more<br />
details, see www.uis.unesco.org.<br />
b The net enrolment ratio is the ratio of enrolled<br />
children of the official age for the education level<br />
indicated to the total population at that age.<br />
Net enrolment ratios exceeding 100% reflect<br />
discrepancies between these two data sets.<br />
c Data for some countries may refer to national or<br />
United Nations Educational, Scientific and Cultural<br />
Organization (UNESCO) Institute for Statistics<br />
estimates. For details, see www.uis.unesco.<br />
org. Because data are from different sources,<br />
comparisons across countries should be made with<br />
caution.<br />
d Tertiary enrolment is generally calculated as a<br />
gross ratio.<br />
e Calculated as the ratio of the female enrolment ratio<br />
to the male enrolment ratio.<br />
f In <strong>2006</strong> the UNESCO Institute for Statistics<br />
changed its convention for citing the reference year<br />
of education data to the calendar year in which the<br />
academic or financial year ends—from 2003/04,<br />
for example, to 2004.<br />
g Preliminary UNESCO Institute for Statistics<br />
estimate, subject to further revision.<br />
h Data refer to the 2001 school year.<br />
i Data refer to the 1999 school year.<br />
j Data refer to the 2002 school year.<br />
k Data refer to the 2000 school year.<br />
l Data refer to the 2003 school year.<br />
m National estimate.<br />
n Data refer to a year between 1995 and 1999.<br />
SOURCES<br />
Columns 1 and 3: UNESCO Institute for Statistics<br />
<strong>2006</strong>a.<br />
Column 2: calculated on the basis of data on adult<br />
literacy rates from UNESCO Institute for Statistics<br />
<strong>2006</strong>a.<br />
Column 4: calculated on the basis of data on youth<br />
literacy rates from UNESCO Institute for Statistics<br />
<strong>2006</strong>a.<br />
Columns 5, 7 and 9: UNESCO Institute for Statistics<br />
<strong>2006</strong>c.<br />
Columns 6, 8 and 10: calculated on the basis of<br />
data on net enrolment rates from UNESCO Institute for<br />
Statistics <strong>2006</strong>c.<br />
440<br />
BERICHT ÜBER DIE MENSCHLICHE ENTWICKLUNG <strong>2006</strong>