- Seite 1 und 2:
Bericht über die menschliche Entwi
- Seite 3 und 4:
Bericht über die menschliche Entwi
- Seite 5 und 6:
Team für die Ausarbeitung des Beri
- Seite 7 und 8:
Todesursache bei Kindern. Jeden Tag
- Seite 9 und 10:
Danksagungen Dieser Bericht wäre o
- Seite 11 und 12:
Eva Quintana Mourelle, Xavi Ramos,
- Seite 13 und 14:
Kapitel 2 Wasser für den menschlic
- Seite 15 und 16:
1.3 Die „fliegenden Toiletten“
- Seite 17 und 18:
1.20 Einige Regionen liegen weit hi
- Seite 19 und 20:
…Wissen zu erwerben… 11 Engagem
- Seite 21 und 22:
Die Überwindung der Krise bei der
- Seite 23 und 24:
Kein Terrorakt hat je so große wir
- Seite 25 und 26:
Von einer funktionierenden Wasser-
- Seite 27 und 28:
Eine funktionierende Wasser- und Sa
- Seite 29 und 30:
Wasser- und Sanitärversorgung sind
- Seite 31 und 32:
Die Armen erhalten weniger Zugang z
- Seite 33 und 34:
Das Kriterium für die Bewertung po
- Seite 35 und 36:
Mehr noch als die Wasserversorgung
- Seite 37 und 38:
Gnadenloser Wettbewerb, Umweltbelas
- Seite 39 und 40:
Der Klimawandel verändert rund um
- Seite 41 und 42:
In vielen Entwicklungsländern vers
- Seite 43 und 44:
Aus den Wasserreformen lässt sich
- Seite 45 und 46:
Die Befürchtung, dass grenzübersc
- Seite 47 und 48:
Unhygienisches Wasser und unzureich
- Seite 49 und 50:
Acht Gründe, weshalb die Welt bei
- Seite 51 und 52:
Acht Gründe, weshalb die Welt bei
- Seite 53 und 54:
„Das Menschenrecht auf Wasser ber
- Seite 55 und 56:
1 Die Krise der Wasser- und Sanitä
- Seite 57 und 58:
1 Kasten 1.1 Ein großer Sprung nac
- Seite 59 und 60:
1 Kasten 1.2 Den Zusammenhang zwisc
- Seite 61 und 62:
1 Die Krise der Wasser- und Sanitä
- Seite 63 und 64:
1 Die Krise der Wasser- und Sanitä
- Seite 65 und 66:
1 Die Krise der Wasser- und Sanitä
- Seite 67 und 68:
1 Kasten 1.3 Die „fliegenden Toil
- Seite 69 und 70:
1 Die Krise der Wasser- und Sanitä
- Seite 71 und 72:
1 Kasten 1.4 Die Kluft zwischen der
- Seite 73 und 74:
1 Die Krise der Wasser- und Sanitä
- Seite 75 und 76:
1 Die Krise der Wasser- und Sanitä
- Seite 77 und 78:
1 Die Krise der Wasser- und Sanitä
- Seite 79 und 80:
1 Die Krise der Wasser- und Sanitä
- Seite 81 und 82:
1 Die Krise der Wasser- und Sanitä
- Seite 83 und 84:
1 Die Krise der Wasser- und Sanitä
- Seite 85 und 86:
1 Die Krise der Wasser- und Sanitä
- Seite 87 und 88:
1 Die Krise der Wasser- und Sanitä
- Seite 89 und 90:
1 Grafik 1.19 Regionale Unterschied
- Seite 91 und 92:
1 Die Krise der Wasser- und Sanitä
- Seite 93 und 94:
1 Die Krise der Wasser- und Sanitä
- Seite 95 und 96:
1 Die Krise der Wasser- und Sanitä
- Seite 97 und 98:
1 Die Krise der Wasser- und Sanitä
- Seite 99 und 100:
1 Die Krise der Wasser- und Sanitä
- Seite 101 und 102:
1 Kasten 1.6 Südafrika - aktives H
- Seite 103 und 104:
1 Die Krise der Wasser- und Sanitä
- Seite 105 und 106:
1 Die Krise der Wasser- und Sanitä
- Seite 107 und 108:
1 Grafik 1.25 Die Priorität in den
- Seite 109 und 110:
1 Die Krise der Wasser- und Sanitä
- Seite 111 und 112:
1 Die Krise der Wasser- und Sanitä
- Seite 113 und 114:
1 Sonderbeitrag: Die Finanzierung z
- Seite 115 und 116:
1 Die Krise der Wasser- und Sanitä
- Seite 117 und 118:
„Wir empfinden es als unsere Pfli
- Seite 119 und 120:
Sonderbeitrag: Zugang zu sauberem W
- Seite 121 und 122:
Menschenrechts auf Wasser eine Roll
- Seite 123 und 124:
2 Wasser für den menschlichen Verb
- Seite 125 und 126:
2 Wasser für den menschlichen Verb
- Seite 127 und 128:
2 Wasser für den menschlichen Verb
- Seite 129 und 130:
2 Wasser für den menschlichen Verb
- Seite 131 und 132:
2 Wasser für den menschlichen Verb
- Seite 133 und 134:
2 Wasser für den menschlichen Verb
- Seite 135 und 136:
2 Wasser für den menschlichen Verb
- Seite 137 und 138:
2 Wasser für den menschlichen Verb
- Seite 139 und 140:
2 Wasser für den menschlichen Verb
- Seite 141 und 142:
2 Wasser für den menschlichen Verb
- Seite 143 und 144:
2 Wasser für den menschlichen Verb
- Seite 145 und 146:
2 Wasser für den menschlichen Verb
- Seite 147 und 148:
2 Wasser für den menschlichen Verb
- Seite 149 und 150:
2 Wasser für den menschlichen Verb
- Seite 151 und 152:
2 Wasser für den menschlichen Verb
- Seite 153 und 154:
Kasten 2.9 Wasserversorgung auf dem
- Seite 155 und 156:
2 Wasser für den menschlichen Verb
- Seite 157 und 158:
2 Wasser für den menschlichen Verb
- Seite 160 und 161:
3 Das riesige Defizit bei der Sanit
- Seite 162 und 163:
KAPITEL 3 Das riesige Defizit bei d
- Seite 164 und 165:
Das Beängstigendste am Defizit bei
- Seite 166 und 167:
dazu, dass mehr als vier Fünftel d
- Seite 168 und 169:
seine Nachbarn mit. Der hohe extern
- Seite 170 und 171:
Sonderbeitrag: Wasser- und Sanitär
- Seite 172 und 173:
das Nichtvorhandensein von sauberem
- Seite 174 und 175:
Sanitärversorgung für alle in Rei
- Seite 176 und 177:
Kasten 3.4 Bangladeschs Kampagne f
- Seite 178 und 179:
wert einräumt. Diese Denkweise lä
- Seite 180 und 181:
einem nachhaltigen Anstieg des Vers
- Seite 182 und 183:
Das Finanzierungsproblem Wie bei de
- Seite 184 und 185:
Der künftige Weg Die Mitwirkung de
- Seite 186 und 187:
4 Wasserknappheit, Risiken und Anf
- Seite 188 und 189:
KAPITEL 4 Wasserknappheit, Risiken
- Seite 190 und 191:
Mangel in einer Welt mit Wasserknap
- Seite 192 und 193:
• Verstärkte Knappheit in Afrika
- Seite 194 und 195:
men und veränderte Ernährungsgewo
- Seite 196 und 197:
esitzt, die sich wirksam Gehör ver
- Seite 198 und 199:
etwas gegen nicht nachhaltige Wasse
- Seite 200 und 201:
Kasten 4.1 China: Umgang mit einer
- Seite 202 und 203:
Die Grundwasserübernutzung macht d
- Seite 204 und 205:
dem Kostendeckungsniveau festgesetz
- Seite 206 und 207:
• Anwendung des Verursacherprinzi
- Seite 208 und 209:
Umkehrosmose sind die Produktionsko
- Seite 210 und 211:
20 Millionen Hektar Land direkt ode
- Seite 212 und 213:
unmittelbar in den Wurzelbereich de
- Seite 214 und 215:
Kasten 4.7 Integrierte Wasserressou
- Seite 216 und 217:
Fällen große Umweltschäden verur
- Seite 218 und 219:
Kasten 4.8 Dürren, Überschwemmung
- Seite 220 und 221:
zip verankert, dass Treibhausgase a
- Seite 222 und 223:
Die Konzentrationen an Kohlendioxid
- Seite 224 und 225:
Karte 4.2 Der Klimawandel wird in v
- Seite 226 und 227:
Karte 4.3 Am stärksten betroffene
- Seite 228 und 229:
Kasten 4.9 Schmelzende Wasserspeich
- Seite 230 und 231:
Katastrophen betroffen. Verletzunge
- Seite 232 und 233:
Ein prüfender Blick über die Mind
- Seite 234 und 235:
gilt sowohl für bilaterale Hilfe a
- Seite 236 und 237:
„Zu den vielen Dingen, die ich al
- Seite 238 und 239:
5 Konkurrenz um Wasser in der Landw
- Seite 240 und 241:
5 Konkurrenz um Wasser in der Landw
- Seite 242 und 243:
5 Konkurrenz um Wasser in der Landw
- Seite 244 und 245:
Gesicherte Wasserrechte können die
- Seite 246 und 247:
Kasten 5.2 Wasserhandel im Westen d
- Seite 248 und 249:
5 Konkurrenz um Wasser in der Landw
- Seite 250 und 251:
Kasten 5.5 Fabriken gegen Bauern in
- Seite 252 und 253:
5 Konkurrenz um Wasser in der Landw
- Seite 254 und 255:
Kasten 5.7 Gewinner und Verlierer d
- Seite 256 und 257:
5 Konkurrenz um Wasser in der Landw
- Seite 258 und 259:
5 Konkurrenz um Wasser in der Landw
- Seite 260 und 261:
5 Konkurrenz um Wasser in der Landw
- Seite 262 und 263:
5 Konkurrenz um Wasser in der Landw
- Seite 264 und 265:
5 Konkurrenz um Wasser in der Landw
- Seite 266 und 267:
5 Konkurrenz um Wasser in der Landw
- Seite 268 und 269:
5 Konkurrenz um Wasser in der Landw
- Seite 270 und 271:
5 Konkurrenz um Wasser in der Landw
- Seite 272 und 273:
6 Die Bewirtschaftung grenzübersch
- Seite 274 und 275:
KAPITEL 6 Die Bewirtschaftung grenz
- Seite 276 und 277:
Gegenseitige Abhängigkeit beim Was
- Seite 278 und 279:
Karte 6.1 Afrikas Flüsse und Seen
- Seite 280 und 281:
Karte 6.2 Myanmar Der Mekong verbin
- Seite 282 und 283:
Die negativen Folgen unterlassener
- Seite 284 und 285:
Karte 6.3 Der verschwindende Tschad
- Seite 286 und 287:
Amu Darja Syr Darja Amu Darja Syr D
- Seite 288 und 289:
zugsgebiet, das sie sich mit Weißr
- Seite 290 und 291:
Kasten 6.2 Wasserrechte in den bese
- Seite 292 und 293:
liche Entwicklung. Das Übereinkomm
- Seite 294 und 295:
Rolle bei der „Grünen Revolution
- Seite 296 und 297:
Im Rückblick auf die letzten 50 Ja
- Seite 298 und 299:
en Platz auf der politischen Agenda
- Seite 300 und 301:
Kasten 6.4 Die Kooperation in Fluss
- Seite 302 und 303:
Kasten 6.5 Regionale Integration du
- Seite 304 und 305:
Ubangi-Fluss in den Chari-Fluss umz
- Seite 306 und 307:
samen Wasserressourcen und ist den
- Seite 308 und 309:
entierten Ansatz zur Bestimmung von
- Seite 310 und 311:
48 WSP-AF, noch nicht erschienen. 4
- Seite 312 und 313:
Bibliografische Erläuterungen Chap
- Seite 314 und 315:
Bibliografie Commissioned research
- Seite 316 und 317:
aquafed.org/pdf/Operators_Right-to-
- Seite 318 und 319:
CDC (Center for Disease Control and
- Seite 320 und 321:
———. 2004a. “Gender and Foo
- Seite 322 und 323:
Hare, Bill, and Malte Meinhausen. 2
- Seite 324 und 325:
Kemper, Karin E. 2001. “Markets f
- Seite 326 und 327:
Frameworks for Rural Water Manageme
- Seite 328 und 329:
Peña, H., M. Luraschi, and S. Vale
- Seite 330 und 331:
Schneider, S. H., and J. Lane. 2006
- Seite 332 und 333:
Turner, Jennifer L., and Timothy Hi
- Seite 334 und 335:
WBCSD (World Business Council for S
- Seite 336 und 337:
Yoffe, Shira B., and Aaron T. Wolf.
- Seite 339 und 340:
Der Stand der menschlichen Entwickl
- Seite 341 und 342:
erreicht ist (siehe Technische Erl
- Seite 343 und 344:
Kasten 1 Die Feminisierung von HIV/
- Seite 345 und 346:
Die Unterschiede beim Schulbesuch a
- Seite 347 und 348:
Die Verwirklichung einer stärkeren
- Seite 349 und 350:
Grafik 8 Überlebenschancen hängen
- Seite 351 und 352:
(nationalen Quellen zufolge ging de
- Seite 353 und 354:
vante Informationen zur Verfügung
- Seite 355 und 356:
früheren Jahre sich auf die Summe
- Seite 357 und 358:
und „Menschen, die nicht lesen un
- Seite 359 und 360:
Tabellen 24 und 25: Neue Überlegun
- Seite 361 und 362:
haben sich die Daten über Gewalt i
- Seite 363 und 364:
…die persönliche Sicherheit zu g
- Seite 365 und 366:
TABLE 1 Human development index Hum
- Seite 367 und 368:
TABLE 1 Human development index Com
- Seite 369 und 370:
TABLE 2 Monitoringhumandevelopment:
- Seite 371 und 372:
TABLE 2 Human development index tre
- Seite 373 und 374:
TABLE 3 Monitoringhumandevelopment:
- Seite 375 und 376:
TABLE 3 Humanandincomepoverty:devel
- Seite 377 und 378: TABLE 4 Human and income poverty: O
- Seite 379 und 380: TABLE 5 Demographic trends Human de
- Seite 381 und 382: TABLE 5 Demographic trends Populati
- Seite 383 und 384: TABLE 6 Commitment to health: resou
- Seite 385 und 386: TABLE 6 Commitment to health: resou
- Seite 387 und 388: TABLE 7 Water, sanitation and nutri
- Seite 389 und 390: TABLE 7 Water, sanitation and nutri
- Seite 391 und 392: TABLE 8 Inequalitiesinmaternalandch
- Seite 393 und 394: TABLE 9 Leadingglobalhealthcrisesan
- Seite 395 und 396: TABLE 9 Leadingglobalhealthcrisesan
- Seite 397 und 398: TABLE 10 Survival: progress and set
- Seite 399 und 400: TABLE 10 Survival: progress and set
- Seite 401 und 402: TABLE 11 Commitment to education: p
- Seite 403 und 404: TABLE Commitment to education: publ
- Seite 405 und 406: TABLE 12 Literacy and enrolment Hum
- Seite 407 und 408: TABLE 12 Literacy and enrolment Adu
- Seite 409 und 410: TABLE 13 Technology: diffusion and
- Seite 411 und 412: TABLE Technology: diffusion and cre
- Seite 413 und 414: TABLE 14 Economic performance Human
- Seite 415 und 416: TABLE 14 Economic performance GDP p
- Seite 417 und 418: TABLE 15 Inequalityinincomeorexpend
- Seite 419 und 420: TABLE 15 Inequalityinincomeorexpend
- Seite 421 und 422: TABLE 16 Thestructureoftrade Human
- Seite 423 und 424: TABLE Thestructureoftrade Importsof
- Seite 425 und 426: TABLE 18 . . . to have access to th
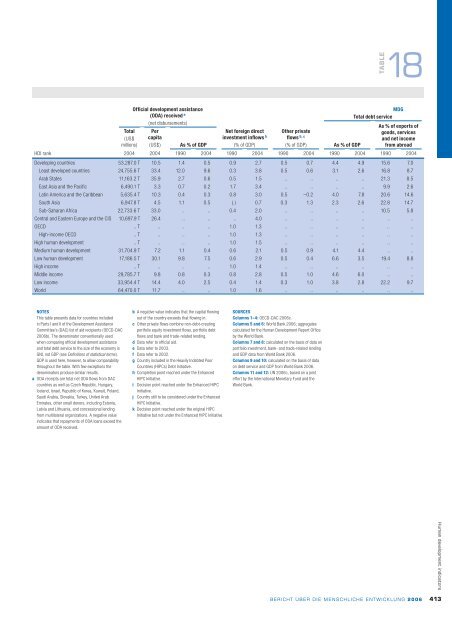
- Seite 427: TABLE 18 Flows of aid, private capi
- Seite 431 und 432: TABLE 19 Prioritiesinpublicspending
- Seite 433 und 434: TABLE 20 . Unemployed people (thous
- Seite 435 und 436: TABLE 21 Energy and the environment
- Seite 437 und 438: TABLE 21 Energy and the environment
- Seite 439 und 440: TABLE 22 Refugees and armaments Hum
- Seite 441 und 442: TABLE 22 Refugees and armaments Con
- Seite 443 und 444: TABLE Victims of crime Population v
- Seite 445 und 446: TABLE 24 Gender-related development
- Seite 447 und 448: TABLE 24 Gender-related development
- Seite 449 und 450: TABLE 25 Gender empowerment measure
- Seite 451 und 452: Gender empowerment measure Female l
- Seite 453 und 454: TABLE 26 Gender inequality in educa
- Seite 455 und 456: TABLE 26 Gender inequality in educa
- Seite 457 und 458: TABLE 27 Gender inequality in econo
- Seite 459 und 460: Gender inequality in economic activ
- Seite 461 und 462: TABLE 29 . . . and achieving equali
- Seite 463 und 464: TABLE 29 Women’s political partic
- Seite 465 und 466: TABLE 30 Human and labour rights in
- Seite 467 und 468: TABLE 30 Status of major internatio
- Seite 469 und 470: TABLE 31 Human and labour rights in
- Seite 471 und 472: TABLE 31 Status of fundamental labo
- Seite 473 und 474: TECHNICAL NOTE 1 Calculating the hu
- Seite 475 und 476: Human development indicators BERICH
- Seite 477 und 478: Calculating the GDI (continued) Sec
- Seite 479 und 480:
Human development indicators BERICH
- Seite 481 und 482:
5-23attendingschooloruniversity,whe
- Seite 483 und 484:
prior to the interview. A logit mod
- Seite 485 und 486:
available to supply, labour for the
- Seite 487 und 488:
FundandtheWorldBankcommits,underthe
- Seite 489 und 490:
patentee. The protection of inventi
- Seite 491 und 492:
Statistical references Charmes, Jac
- Seite 493 und 494:
Classification of countries Countri
- Seite 495 und 496:
Countries in the major world aggreg
- Seite 497 und 498:
Indextoindicators Indicator table I
- Seite 499 und 500:
Indicator table Indicator Indicator
- Seite 501 und 502:
Index to Millennium Development Goa
- Seite 503 und 504:
Länderschlüssel HDI rank 73 102 1
- Seite 505:
ISBN: 3-923904-63-0 Bericht über d