- Page 1 and 2:
Warning: Please note that this PDF
- Page 3 and 4:
INTERNATIONAL ENERGY AGENCY The Int
- Page 5 and 6:
It is possible to go further and fa
- Page 7 and 8:
Riccardo Quercioli, Julia Reinaud,
- Page 9 and 10:
Alternative Policy Scenario Tera Al
- Page 11 and 12:
John Mitchell Chatham House, UK Hos
- Page 13 and 14:
© OECD/IEA, 2007
- Page 15 and 16:
T A B L E O F C O N T E N T S PART
- Page 17 and 18:
Foreword 3 Acknowledgements 5 List
- Page 19 and 20:
8 9 Supply 179 Inter-Regional Trade
- Page 21 and 22:
13 14 Prospects for Nuclear Power 3
- Page 23 and 24:
List of Figures Chapter 1. Key Assu
- Page 25 and 26:
6.9 Impact of Carbon Value on Gener
- Page 27 and 28:
9.13 Growth in Road and Aviation Oi
- Page 29 and 30:
13.3 Shares of Nuclear Power in Ele
- Page 31 and 32:
Chapter 2. Global Energy Trends 2.1
- Page 33 and 34:
11.4 Change in Primary Energy Deman
- Page 35 and 36:
Chapter 3. Oil Market Outlook 3.1 C
- Page 37 and 38:
World Energy Outlook Series World E
- Page 39 and 40:
half of the increase in global prim
- Page 41 and 42:
Will the investment come? Meeting t
- Page 43 and 44:
World primary energy demand in 2030
- Page 45 and 46:
above $4.70 per MBtu. Nuclear power
- Page 47 and 48:
Larger energy savings would require
- Page 49 and 50:
© OECD/IEA, 2007
- Page 51 and 52:
would be needed (over and above tho
- Page 53 and 54:
© OECD/IEA, 2007
- Page 55 and 56:
Government Policies and Measures As
- Page 57 and 58:
over the projection period, as it d
- Page 59 and 60:
for heating, and faster improvement
- Page 61 and 62:
Figure 1.2: Growth in Real GDP Per
- Page 63 and 64:
dollars per barrel Figure 1.3: Aver
- Page 65 and 66:
is assumed that available end-use t
- Page 67 and 68:
Demand Primary Energy Mix Global pr
- Page 69 and 70:
een revised down and that for coal
- Page 71 and 72:
Mtoe 10 000 8 000 6 000 4 000 2 000
- Page 73 and 74:
Figure 2.4: Fuel Shares in World Fi
- Page 75 and 76:
Table 2.2: Net Energy Imports by Ma
- Page 77 and 78:
capacity for oil, gas, coal and ele
- Page 79 and 80:
Exploration and development Explora
- Page 81 and 82:
China United States Middle East Ind
- Page 83 and 84:
illion tonnes 25 20 15 10 5 Figure
- Page 85 and 86:
© OECD/IEA, 2007
- Page 87 and 88:
Demand 1 Primary oil 2 demand is ex
- Page 89 and 90:
far the largest consumer. The econo
- Page 91 and 92:
new field wildcats, 1996-2005 log s
- Page 93 and 94:
Table 3.2: World Oil Supply (millio
- Page 95 and 96:
the Organization of the Petroleum E
- Page 97 and 98:
A lack of reliable information on p
- Page 99 and 100:
Table 3.3: Major New Oil-Sands Proj
- Page 101 and 102:
mb/d Figure 3.8: Non-Conventional O
- Page 103 and 104:
Investment Cumulative global invest
- Page 105 and 106:
amounts to around $260 billion. Inv
- Page 107 and 108:
Environmental policies and regulati
- Page 109 and 110:
growth marginally, pushing demand d
- Page 111 and 112:
© OECD/IEA, 2007
- Page 113 and 114:
Demand Primary gas consumption is p
- Page 115 and 116:
The long-term rate of increase in G
- Page 117 and 118:
cm Figure 4.3: Natural Gas Producti
- Page 119 and 120:
Table 4.2: Inter-Regional* Natural
- Page 121 and 122:
Box 4.1: LNG Set to Fill the Growin
- Page 123 and 124:
construction of upstream and downst
- Page 125 and 126:
investment is incremental and where
- Page 127 and 128:
Demand Global coal use is projected
- Page 129 and 130:
Figure 5.1: Share of Power Generati
- Page 131 and 132:
international demand. In contrast,
- Page 133 and 134:
Table 5.3: Hard Coal* Net Inter-Reg
- Page 135 and 136:
Consolidation of the mining industr
- Page 137 and 138:
� Exchange rates: A drop in the v
- Page 139 and 140:
Electricity Demand Outlook Global e
- Page 141 and 142:
TWh Figure 6.3: World Incremental E
- Page 143 and 144:
generating capacity from 364 GW in
- Page 145 and 146:
The share of non-hydro renewable so
- Page 147 and 148:
y insufficient LNG infrastructure.
- Page 149 and 150:
phase-out policies require 27 GW of
- Page 151 and 152:
illion dollars (2005) 5 000 4 000 3
- Page 153 and 154:
Increasing interconnection capacity
- Page 155 and 156:
(in year-2005 dollars). These refor
- Page 157 and 158:
Figure 6.17: Population without Ele
- Page 159 and 160:
© OECD/IEA, 2007
- Page 161 and 162:
© OECD/IEA, 2007
- Page 163 and 164:
� Policies encouraging more effic
- Page 165 and 166:
the additional policies and technol
- Page 167 and 168:
fossil-fuel and renewable energy so
- Page 169 and 170:
Table 7.1: Selected Policies Includ
- Page 171 and 172:
Energy Prices and Macroeconomic Ass
- Page 173 and 174:
lower cost than in the Reference Sc
- Page 175 and 176:
The reduction in the use of fossil
- Page 177 and 178:
global consumption of biomass is 58
- Page 179 and 180:
compared with 1.3% in the Reference
- Page 181 and 182:
production. For these reasons, we a
- Page 183 and 184:
mb/d Figure 7.7: Increase in Net Oi
- Page 185 and 186:
markets is significantly lower in t
- Page 187 and 188:
Production and Trade As in the Refe
- Page 189 and 190:
in the long run (in particular main
- Page 191 and 192:
Notwithstanding the rates of growth
- Page 193 and 194:
Figure 7.14: Global Savings in CO 2
- Page 195 and 196:
Investment in Energy-Supply Infrast
- Page 197 and 198:
Investment along the Electricity Ch
- Page 199 and 200:
Demand-Side Investment Additional d
- Page 201 and 202:
Figure 8.2: Demand-Side Investment
- Page 203 and 204:
Supply-Side Investment In the Alter
- Page 205 and 206:
Table 8.3: Cumulative Oil and Gas I
- Page 207 and 208:
and another to buy a car. But there
- Page 209 and 210:
Box 8.4: Energy Savings Programme i
- Page 211 and 212:
With the exception of China (where
- Page 213 and 214:
© OECD/IEA, 2007
- Page 215 and 216:
Power Generation Summary of Results
- Page 217 and 218:
Table 9.2 shows the changes in elec
- Page 219 and 220:
Nuclear power capacity rises to 519
- Page 221 and 222:
Biowaste Solar photovoltaic grammes
- Page 223 and 224:
The Alternative Policy Scenario ass
- Page 225 and 226:
As oil is the principal fuel in tra
- Page 227 and 228:
Fuel Economy Governments intervene
- Page 229 and 230:
The broad categories of policy ment
- Page 231 and 232:
millions 100 80 60 40 20 0 Figure 9
- Page 233 and 234:
period. The fleet grows most rapidl
- Page 235 and 236:
emissions alone (IPCC, 1999). Using
- Page 237 and 238:
greater use of biomass- and gas-fir
- Page 239 and 240:
energy-intensive processes in both
- Page 241 and 242:
more than 1 000 tce per tonne of st
- Page 243 and 244:
Almost all of the 21 Mtoe savings i
- Page 245 and 246:
which have much lower equipment own
- Page 247 and 248:
Policy Overview Policies taken into
- Page 249 and 250:
� Utility energy efficiency schem
- Page 251 and 252:
� Four-fifths of the energy and e
- Page 253 and 254:
Table 10.1: Most Effective Policies
- Page 255 and 256:
These examples reflect differences
- Page 257 and 258:
countries (for example in relation
- Page 259 and 260:
Gt of CO 2 Figure 10.2: Reduction i
- Page 261 and 262:
� Introduction of CO2 capture and
- Page 263 and 264:
Implications for Energy Security Th
- Page 265 and 266:
ole in power supply, if its costs c
- Page 267 and 268:
© OECD/IEA, 2007
- Page 269 and 270:
© OECD/IEA, 2007
- Page 271 and 272:
Introduction Since the first oil sh
- Page 273 and 274:
y about 60% of the increase in the
- Page 275 and 276:
second-largest consumer of gas - ga
- Page 277 and 278:
Figure 11.5: Change in Real Energy
- Page 279 and 280:
OECD, but remain large in some non-
- Page 281 and 282:
Figure 11.7: Economic Value of Ener
- Page 283 and 284:
Impact of Higher Energy Prices on D
- Page 285 and 286:
Figure 11.8: Increase in World Prim
- Page 287 and 288:
complicated by the role played by o
- Page 289 and 290:
crude oil price elasticity of fuel
- Page 291 and 292:
higher oil prices. Exceptional fact
- Page 293 and 294:
2004. It is projected to increase f
- Page 295 and 296:
to drive prices up. Demand appears
- Page 297 and 298:
on the results of our assessment of
- Page 299 and 300:
countries, a price increase directl
- Page 301 and 302:
toe per thousand dollars of GDP* 0.
- Page 303 and 304:
to examine the issue, reflecting th
- Page 305 and 306:
Table 11.5: IMF Analysis of the Mac
- Page 307 and 308:
actually did since 2002. 17 The ave
- Page 309 and 310:
0.9 percentage points higher in 200
- Page 311 and 312:
Most OECD countries have experience
- Page 313 and 314:
developing countries has risen by 4
- Page 315 and 316:
$0.2 trillion (see Chapter 8). The
- Page 317 and 318:
� The five years to 2010 will see
- Page 319 and 320:
spending of the 40 companies, accor
- Page 321 and 322:
downstream activities, including GT
- Page 323 and 324:
illion dollars Figure 12.4: Investm
- Page 325 and 326:
Table 12.2: Sanctioned and Planned
- Page 327 and 328:
While most upstream investment cont
- Page 329 and 330:
increasing by as much as 100% for a
- Page 331 and 332:
Figure 12.11: Availability of Petro
- Page 333 and 334:
and Africa account for 70% of total
- Page 335 and 336:
mb/d Figure 12.14: Cumulative Addit
- Page 337 and 338:
Figure 12.15: World Oil Refinery In
- Page 339 and 340:
Table 12.3: Natural Gas Liquefactio
- Page 341 and 342:
approved by the US Maritime Adminis
- Page 343 and 344:
The prospects for investment and pr
- Page 345 and 346:
Current Status of Nuclear Power Ren
- Page 347 and 348:
Nuclear Power Today Nuclear power p
- Page 349 and 350:
Table 13.2: The Ten Largest Nuclear
- Page 351 and 352:
Figure 13.3: Shares of Nuclear Powe
- Page 353 and 354:
Operating Licence (COL). The Energy
- Page 355 and 356:
Table 13.6: Main Policies Related t
- Page 357 and 358:
Lithuania and Bulgaria are consider
- Page 359 and 360:
Table 13.7: Examples of High-Level
- Page 361 and 362:
Outlook for Nuclear Power In the Re
- Page 363 and 364:
Table 13.8: Nuclear Capacity and Sh
- Page 365 and 366:
light-water reactors (VVER) in two
- Page 367 and 368:
assumptions used throughout the Out
- Page 369 and 370:
OECD price in 2005 and within the a
- Page 371 and 372:
increase in generating cost Figure
- Page 373 and 374:
estimates. Approximately three-quar
- Page 375 and 376:
disposal or reprocessing followed b
- Page 377 and 378:
associated with nuclear power. Expe
- Page 379 and 380:
Figure 13.13: Identified Uranium Re
- Page 381 and 382:
nuclear fuels in the long term, tho
- Page 383 and 384:
Figure 13.16: Uranium Oxide (U 3 O
- Page 385 and 386:
proliferation arising from civil nu
- Page 387 and 388:
Current Status of Biofuels Producti
- Page 389 and 390:
Czech Republic Ethanol Figure 14.1:
- Page 391 and 392:
Mtoe 20 16 12 8 4 0 } 95% growth 20
- Page 393 and 394:
equires estimates of, or assumption
- Page 395 and 396:
Prospects for Biofuels Production a
- Page 397 and 398: 32% 28% 24% 20% 16% 12% 8% 4% 0% Fi
- Page 399 and 400: Table 14.3: Summary of Current Gove
- Page 401 and 402: Regional Trends Brazil Biofuels con
- Page 403 and 404: Table 14.4: US Biofuels Production
- Page 405 and 406: EU biofuels production and use have
- Page 407 and 408: Figure 14.7: Biofuel Production Cos
- Page 409 and 410: $0.50/litre in the United States (b
- Page 411 and 412: Table 14.5: Performance Characteris
- Page 413 and 414: for supplying biomass residues woul
- Page 415 and 416: 200 EJ (4 800 Mtoe) of biomass prod
- Page 417 and 418: in the Alternative Policy Scenario
- Page 420 and 421: CHAPTER 15 ENERGY FOR COOKING IN DE
- Page 422 and 423: charcoal generates significant empl
- Page 424 and 425: Figure 15.1: Share of Traditional B
- Page 426 and 427: 1.3 million people) are due to biom
- Page 428 and 429: The effects of exposure to indoor a
- Page 430 and 431: Figure 15.5: Woodfuel Supply and De
- Page 432 and 433: poverty (MDG 1) and can play a crit
- Page 434 and 435: Improving the Way Biomass is Used F
- Page 436 and 437: In view of their ability to reduce
- Page 438 and 439: Implications for Oil Demand LPG is
- Page 440 and 441: 50% target 2015-2030 100% provision
- Page 442 and 443: The trend worldwide is towards remo
- Page 444 and 445: Box 15.3: The Role of Microfinance
- Page 446: The benefit/cost ratio of governmen
- Page 451 and 452: Administration has increased public
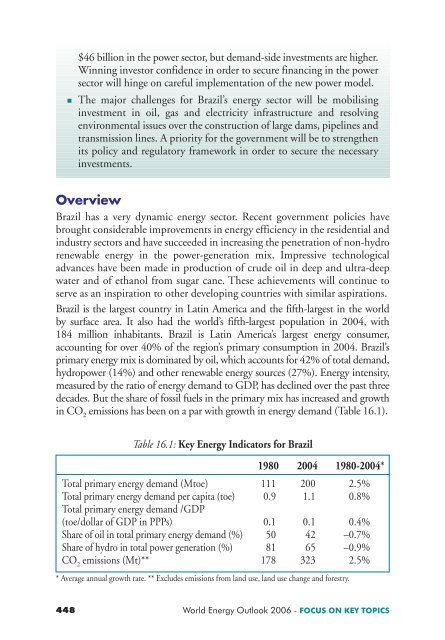
- Page 453 and 454: Brazil’s rate of population growt
- Page 455 and 456: Outlook for Energy Demand Brazil’
- Page 457 and 458: domestic oil production and increas
- Page 459 and 460: Industrial energy demand grows by 1
- Page 461 and 462: Table 16.5: Main Policies and Progr
- Page 463 and 464: southeast regions of Brazil, which
- Page 465 and 466: into the Reference Scenario. End-us
- Page 467 and 468: Figure 16.8: Oil and Gas Fields and
- Page 469 and 470: Table 16.8: Brazil’s Oil Producti
- Page 471 and 472: Figure 16.10: Brazil’s Crude Oil
- Page 473 and 474: Production and Imports Gas producti
- Page 475 and 476: unit would be located off the coast
- Page 477 and 478: This trend is bolstered by strong g
- Page 479 and 480: Figure 16.13: Planned Infrastructur
- Page 481 and 482: The construction of very large hydr
- Page 483 and 484: Box 16.5: Prospects for Renewable E
- Page 485 and 486: stronger policies to connect bagass
- Page 487 and 488: Investment The cumulative amount of
- Page 490 and 491: ANNEXES © OECD/IEA, 2007
- Page 492 and 493: ANNEX A TABLES FOR REFERENCE AND AL
- Page 494 and 495: Reference Scenario: World Electrici
- Page 496 and 497: Reference Scenario: OECD Electricit
- Page 498 and 499:
Reference Scenario: OECD North Amer
- Page 500 and 501:
Reference Scenario: United States E
- Page 502 and 503:
Reference Scenario: OECD Pacific El
- Page 504 and 505:
Reference Scenario: Japan Electrici
- Page 506 and 507:
Reference Scenario: OECD Europe Ele
- Page 508 and 509:
Reference Scenario: European Union
- Page 510 and 511:
Reference Scenario: Transition Econ
- Page 512 and 513:
Reference Scenario: Russia Electric
- Page 514 and 515:
Reference Scenario: Developing Coun
- Page 516 and 517:
Reference Scenario: Developing Asia
- Page 518 and 519:
Reference Scenario: China Electrici
- Page 520 and 521:
Reference Scenario: India Electrici
- Page 522 and 523:
Reference Scenario: Latin America E
- Page 524 and 525:
Reference Scenario: Brazil Electric
- Page 526 and 527:
Reference Scenario: Middle East Ele
- Page 528 and 529:
Reference Scenario: Africa Electric
- Page 530 and 531:
Alternative Policy Scenario: World
- Page 532 and 533:
Alternative Policy Scenario: OECD E
- Page 534 and 535:
Alternative Policy Scenario: OECD N
- Page 536 and 537:
Alternative Policy Scenario: United
- Page 538 and 539:
Alternative Policy Scenario: OECD P
- Page 540 and 541:
Alternative Policy Scenario: Japan
- Page 542 and 543:
Alternative Policy Scenario: OECD E
- Page 544 and 545:
Alternative Policy Scenario: Europe
- Page 546 and 547:
Alternative Policy Scenario: Transi
- Page 548 and 549:
Alternative Policy Scenario: Russia
- Page 550 and 551:
Alternative Policy Scenario: Develo
- Page 552 and 553:
Alternative Policy Scenario: Develo
- Page 554 and 555:
Alternative Policy Scenario: China
- Page 556 and 557:
Alternative Policy Scenario: India
- Page 558 and 559:
Alternative Policy Scenario: Latin
- Page 560 and 561:
Alternative Policy Scenario: Brazil
- Page 562 and 563:
Alternative Policy Scenario: Middle
- Page 564 and 565:
Alternative Policy Scenario: Africa
- Page 566 and 567:
ANNEX B ELECTRICITY ACCESS In a con
- Page 568 and 569:
Table B1: Electricity Access in 200
- Page 570 and 571:
Table B2: Electricity Access in 200
- Page 572 and 573:
Table B4: Electricity Access in 200
- Page 574 and 575:
Annex C - Abbreviations and Definit
- Page 576 and 577:
Dimethyl Ether (DME) Clear, odourle
- Page 578 and 579:
Ligno-Cellulosic Technology Process
- Page 580 and 581:
China China refers to the People’
- Page 582 and 583:
APS Alternative Policy Scenario BAP
- Page 584 and 585:
RS Reference Scenario TFC total fin
- Page 586 and 587:
Annex E - References ANNEX E REFERE
- Page 588 and 589:
CHAPTER 7: Mapping a New Energy Fut
- Page 590 and 591:
Gielen, D. (2006), Energy Efficienc
- Page 592 and 593:
International Energy Agency (IEA)/U
- Page 594 and 595:
CHAPTER 14: The Outlook for Biofuel
- Page 596 and 597:
REN21 Renewable Energy Policy Netwo
- Page 598 and 599:
The Online Bookshop International E
- Page 600 and 601:
IEA PUBLICATIONS, 9, rue de la Féd