- Seite 1 und 2:
D-A-CH TAGUNG 2011Erdbebeningenieur
- Seite 3 und 4:
Herausgeber: Univ.-‐Prof. Dr.-
- Seite 5 und 6:
VorwortDie Deutsche (DGEB), die Ös
- Seite 7 und 8:
Systemidentifikation und dynamische
- Seite 10:
Erdbebeneinwirkung undBoden-Bauwerk
- Seite 13 und 14:
Tabelle 1.1Kennwerte des ErdbebensK
- Seite 15 und 16:
Abb. 1.2 Intensitätsinkrement I au
- Seite 17 und 18:
Abb. 2.2 Einwohnerdichte mit Quelle
- Seite 19 und 20:
Die messtechnischen Untersuchungen
- Seite 21 und 22:
3 ZUSAMMENFASSUNGDie Untersuchungen
- Seite 23 und 24:
12. D-A-CH Tagung - Erdbeben und Ba
- Seite 25 und 26:
earthquakes catalogue. There have b
- Seite 27 und 28:
3 EXPOSURE/VULNERABILITY COMPONENTS
- Seite 29 und 30:
Construction costs have been seen t
- Seite 31 und 32:
The following is the damage grade i
- Seite 33 und 34:
seems reasonable. The scenario also
- Seite 35 und 36:
12. D-A-CH Tagung - Erdbeben und Ba
- Seite 37 und 38:
Parameter erhoben und Karten erstel
- Seite 39 und 40:
Modelle und der langfristigen Über
- Seite 41 und 42:
Abbildung 3. Übersicht über das S
- Seite 43 und 44:
Abbildung 4 zeigt das Beispiel der
- Seite 45 und 46:
[15] M. Gisler, D. Fäh, D. und R.
- Seite 47 und 48:
12. D-A-CH Tagung - Erdbeben und Ba
- Seite 49 und 50:
Umfassendere Untersuchungen für Ti
- Seite 51 und 52:
Der Beruf und das Umfeld des Autors
- Seite 53 und 54:
Nachbeben, welche die Bevölkerung
- Seite 55 und 56:
Puechbergerische Hauss genannt, sto
- Seite 57 und 58:
dies Zerstörung vom Himmel der Sta
- Seite 59 und 60:
12. D-A-CH Tagung - Erdbeben und Ba
- Seite 61 und 62:
2.2 Klassifikationsschema nach DIN
- Seite 63 und 64:
In der Nähe der seismischen Statio
- Seite 65 und 66:
Typ II: Fels bezogene Betrachtung a
- Seite 67 und 68:
Bei der Entwicklung einer Abnahmebe
- Seite 69 und 70:
Abb. 4.6: Magnituden - Entfernungsb
- Seite 71 und 72:
12. D-A-CH Tagung - Erdbeben und Ba
- Seite 73 und 74:
detektiert, so lässt sich eine Abs
- Seite 75 und 76:
M 1M 2M 3R 1,mind2 = R 2,mind 1d 3R
- Seite 77 und 78:
e h r h e v g v( ) ( )∫ frds ⋅R
- Seite 79 und 80:
Abbildung 8: Borinquen Damm 2E, FE-
- Seite 81 und 82:
Kritischer Gleitkreis Nr. 19 t = 9.
- Seite 83 und 84:
12. D-A-CH Tagung - Erdbeben und Ba
- Seite 85 und 86:
Wahlström [16], Leydecker [17], Sc
- Seite 87 und 88:
Abbildung 1: Seismizität in der Re
- Seite 89 und 90:
3.4 01.06.1911Nachts, 00:28 Uhr.- A
- Seite 91 und 92:
A12/B9 zur Intensität VI erscheint
- Seite 93 und 94:
REFERENZEN[1] R. Pelzing, Source pa
- Seite 95 und 96:
12. D-A-CH Tagung - Erdbeben und Ba
- Seite 97 und 98:
Abb. 1:Neue erdbebengeographische E
- Seite 99 und 100:
Abb. 2:Karte der Erdbeben in Deutsc
- Seite 101:
Die Seismizität Deutschlands ist z
- Seite 104 und 105:
1 EINFÜHRUNGBis in die zweite Häl
- Seite 106 und 107:
Das Safe Shutdown Earthquake SSE (A
- Seite 108 und 109:
Einfluss der Geometrie auf den jewe
- Seite 110 und 111:
Abbildung 6: Auszug aus den Feld- u
- Seite 112 und 113:
Abbildung 9: Untersuchte Bodenszena
- Seite 114 und 115:
Depth [m]Dynamic shear-modulus G [M
- Seite 116 und 117:
Ermittlung der Impedanzmatrix i.d.R
- Seite 118 und 119:
f(cut off)= cs /4 (2)wobei c s die
- Seite 120 und 121:
gleichen Oberkonstruktionen (Innen-
- Seite 122 und 123:
[12] Idriss, I. M. (1990). Response
- Seite 124 und 125: 1 INTRODUCTIONUrbane Seismologie un
- Seite 126 und 127: 2 MESSUNG DER SEISMIZITÄT BEI LAND
- Seite 128 und 129: 4.2 Strukturbestimmung unter urbane
- Seite 130 und 131: 120
- Seite 132 und 133: 1 EINFÜHRUNGHerkömmliche Systeme
- Seite 134 und 135: der aufgezeichneten Erdbebenbeschle
- Seite 136 und 137: Hierbei sind b 1 und b 2 die Parame
- Seite 138 und 139: der dominanten P-Phase für jedes Z
- Seite 140 und 141: Coda-Wellen stabiler als für domin
- Seite 142 und 143: [3] J. Bretschneider & R. J. Schere
- Seite 144 und 145: 1. Seismizität. Vor dem 16. Novemb
- Seite 146 und 147: Herdbruchvorgang: unilaterale Bruch
- Seite 148 und 149: Abb. 3.: Verteilung der makroseismi
- Seite 150 und 151: LiteraturCarlé, W., 1955: Bau und
- Seite 152 und 153: 142
- Seite 154 und 155: 1 EINLEITUNGBei der Erdbebenauslegu
- Seite 156 und 157: Alternative ist in [5] folgende Kom
- Seite 158 und 159: Antwortzeitverläufen des linearen
- Seite 160 und 161: Abbildung 5: Vergleich der Verteilu
- Seite 162 und 163: Entfernungen oder Bodenklassen konn
- Seite 164 und 165: 154
- Seite 166 und 167: 1 INTRODUCTIONA key element of seis
- Seite 168 und 169: (records from the K_NET and KiK-net
- Seite 170 und 171: Loss estimates were performed using
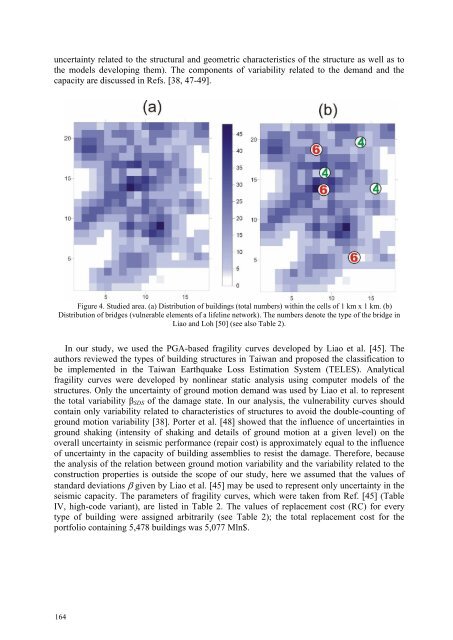
- Seite 172 und 173: Figure 2. (a) Studied area divided
- Seite 176 und 177: Some applications require assessing
- Seite 178 und 179: loss would be smaller than that for
- Seite 180 und 181: Figure 6. Parameters of loss distri
- Seite 182 und 183: damaged at this level. The expected
- Seite 184 und 185: REFERENCES[1] J.J. Bommer, F. Scher
- Seite 186 und 187: [34] R. Lee and A.S. Kiremidjian Un
- Seite 188 und 189: 178Systemidentifikation unddynamisc
- Seite 190 und 191: 1 EINFÜHRUNGDurch höhere Produkti
- Seite 192 und 193: Abb. 1-2 Versuch V1 - MP 41ZAnalyse
- Seite 194 und 195: 48 Hz mit um die Vertikale rotatori
- Seite 196 und 197: diesem Modell ausgehend wurden die
- Seite 198 und 199: Abb. 5-2 TestmessungKeile loseQ = 0
- Seite 200 und 201: Zusätzlich zeigte die Tapio-Analys
- Seite 202 und 203: 1 EINLEITUNGDie deutsche Bundesregi
- Seite 204 und 205: FundamentpratzeCBetonschaftBetonhoh
- Seite 206 und 207: mit einer Abtastfrequenz von bis zu
- Seite 208 und 209: Belastung den Wert der effektiven S
- Seite 210 und 211: [mm][mm]1: 1: Zugkraft [kN]Zugkraft
- Seite 212 und 213: Veröffentlichungen des Grundbauins
- Seite 214 und 215: 1 EINFÜHRUNGDie Firma envergate ag
- Seite 216 und 217: 3 FINITE ELEMENT MODELLDie Modellie
- Seite 218 und 219: 4.2 InstrumentierungEingesetzt wurd
- Seite 220 und 221: Aus der kombinierten Auswertung fü
- Seite 222 und 223: lich Details muss hier auf den Vort
- Seite 224 und 225:
Die Abbildung 16 zeigt die zu den i
- Seite 226 und 227:
1 EINFÜHRUNG1.1 Modale Identifikat
- Seite 228 und 229:
nehmen, zum anderen konnte das dyna
- Seite 230 und 231:
Die mit dem PO-MOESP Algorithmus be
- Seite 232 und 233:
Tragen, da in dieser Richtung diago
- Seite 234 und 235:
Abschließend möchten wir uns für
- Seite 236 und 237:
1 EINLEITUNGNeben niederschlagsindu
- Seite 238 und 239:
geschützt werden. Für den schnell
- Seite 240 und 241:
Abbildung 4: Sensoren die in den SL
- Seite 242 und 243:
Sensorknoten automatisch mit dem Ga
- Seite 244 und 245:
Fig. 7 Finite difference mesh of th
- Seite 246 und 247:
Basierend auf den Echtzeit-Monitori
- Seite 248 und 249:
1 EINLEITUNGDie stetige technologis
- Seite 250 und 251:
gungsmessungen zu berechnen. Für d
- Seite 252 und 253:
5 MODELLIERUNG ERMÜDUNGSRELEVANTER
- Seite 254 und 255:
zusammen mit den Abweichungen der g
- Seite 256 und 257:
gehörige Parameter solange korrigi
- Seite 258 und 259:
[3] N. Isyumov (Hrsg.), Wind tunnel
- Seite 260 und 261:
250
- Seite 262 und 263:
1 EINLEITUNGIm Gegensatz zu bisher
- Seite 264 und 265:
CA B F K1 10CA B 0CA BCA BM1 1
- Seite 266 und 267:
4 MARKOV - PARAMETER ALS SCHADENSIN
- Seite 268 und 269:
Schaden konnte dann anhand der Diff
- Seite 270 und 271:
Anmerkung: Die Deutsche Forschungsg
- Seite 272 und 273:
1 EINLEITUNGTilger sind bei Fussgä
- Seite 274 und 275:
a)100μ = 2%b)100μ = 2%Wirkungsgra
- Seite 276 und 277:
a) b)Abb. 5: a) Schwingungserreger.
- Seite 278 und 279:
Die Eigenwerte und Eigenvektoren la
- Seite 280 und 281:
a)6 x 10⁻⁶b)6 x 10⁻⁶Amplitude42
- Seite 282 und 283:
7 ZUSAMMENFASSUNGDie Identifikation
- Seite 284 und 285:
1 METHODE DER EXPERIMENTELLEN MODAL
- Seite 286 und 287:
3 DURCHFÜHRUNG DER EXPERIMENTELLEN
- Seite 288 und 289:
Abb. 6: Die Formen von sechs Eigens
- Seite 290 und 291:
Für weitergehende Informationen be
- Seite 292 und 293:
Aus den hohen Schwingungsamplituden
- Seite 294 und 295:
nahmen kamen Verstärkungen u.a. am
- Seite 296 und 297:
1 EINLEITUNGDer Nachweis der Stands
- Seite 298 und 299:
3.2 Analyse im FrequenzbereichWenn
- Seite 300 und 301:
Signalkombination für den rotatori
- Seite 302 und 303:
Abbildung 7: Skizze deviatorischer
- Seite 304 und 305:
Die Scherwellengeschwindigkeit vsis
- Seite 306 und 307:
6 ZUSAMMENFASSUNGDie Methode mittel
- Seite 308 und 309:
1 INTRODUCTIONThe assessment of exi
- Seite 310 und 311:
model. An image of the preliminary
- Seite 312 und 313:
Figure 6: Examples for local mode s
- Seite 314 und 315:
4.2 Extensive modal analysisTwo of
- Seite 316 und 317:
Table 5 - continued from previous p
- Seite 318 und 319:
5 CONCLUSIONSIn the described study
- Seite 320 und 321:
310Beurteilung und Ertüchtigungbes
- Seite 322 und 323:
1 EINLEITUNG1.1 Ziel und NutzenDie
- Seite 324 und 325:
ParameterG 01ErdbebenzoneG 02Regula
- Seite 326 und 327:
Aus den in jüngster Vergangenheit
- Seite 328 und 329:
Schadensrelevanz [SR]300250200150SR
- Seite 330 und 331:
Schadensgrade nach EMS-98Schadensgr
- Seite 332 und 333:
the 12th European Conference on Ear
- Seite 334 und 335:
1 EINLEITUNGBei der seismischen Aus
- Seite 336 und 337:
2.3 ÜbertragungsfunktionenIm zweit
- Seite 338 und 339:
untersucht werden soll, wird in den
- Seite 340 und 341:
Aus den Übertragungsfunktionen des
- Seite 342 und 343:
(Abbildung 5(d)-(f)) zu erkennen. W
- Seite 344 und 345:
Generell sind in dem für Erdbeben
- Seite 346 und 347:
weiter vom Anregungsfrequenzbereich
- Seite 348 und 349:
1 DAS PROJEKT SEISMOFITSEISMOFIT is
- Seite 350 und 351:
Verformungskapazität wird erhöht
- Seite 352 und 353:
der drei Gebäudeteile im Grundriss
- Seite 354 und 355:
Modell 1 Modell 2 Modell 3Abbildung
- Seite 356 und 357:
Abbildung 13: Erste Längsschwingun
- Seite 358 und 359:
REFERENZEN[1] European standard EN
- Seite 360 und 361:
1 EINLEITUNGAnkerschienensysteme ko
- Seite 362 und 363:
Modellierungsunsicherheiten nicht p
- Seite 364 und 365:
Weggesteuerte VerfahrenDie FEMA-Ric
- Seite 366 und 367:
3 VERHALTEN VON ANKERSCHIENEN UNTER
- Seite 368 und 369:
Wie in Abbildung 9 angedeutet, best
- Seite 370 und 371:
350003000025000Last [N]2000015000ZZ
- Seite 372 und 373:
3.4.3 Schub in Schienenlängsrichtu
- Seite 374 und 375:
4 ZUSAMMENFASSUNGEinbetonierte Anke
- Seite 376 und 377:
366
- Seite 378 und 379:
1 EINFÜHRUNGMit diesem Beitrag wer
- Seite 380 und 381:
Baubewilligungsverfahren ein.2010 P
- Seite 382 und 383:
Leistungen erbringt. Zurzeit beträ
- Seite 384 und 385:
eigentlich ganzheitlich vom Bauinge
- Seite 386 und 387:
1 EinführungEine Möglichkeit zur
- Seite 388 und 389:
Bild 4: Transformation des Systems
- Seite 390 und 391:
DeckenplatteKopfbalkenAussparungFu
- Seite 392 und 393:
Die Schubtragfähigkeit der Wand wi
- Seite 394 und 395:
Bei den längeren Wänden (2,0 m) i
- Seite 396 und 397:
VERWENDETE LITERATUR[1] M. Nejati,
- Seite 398 und 399:
1 AUFGABENSTELLUNGAIT - damals arse
- Seite 400 und 401:
Vier von fünf Sensoren wurden dire
- Seite 402 und 403:
Abbildung 5: Stahlkonstruktion für
- Seite 404 und 405:
Abbildung 7: 2. Eigenform; links Me
- Seite 406 und 407:
kritischen Bereiche wurden detailli
- Seite 408 und 409:
Bei der Stahlkonstruktion sind die
- Seite 410 und 411:
1 EINLEITUNGTraditionelle Wohnbaute
- Seite 412 und 413:
Abbildung 2: Rayleigh-Dämpfung [2]
- Seite 414 und 415:
Für die Analyse und Beurteilung de
- Seite 416 und 417:
Vergleich Modell 2 bis 6120%le 80%o
- Seite 418 und 419:
408
- Seite 420 und 421:
1 EINLEITUNG1.1 Hintergrund und Zie
- Seite 422 und 423:
Im Sinne eines verhaltensbasierten
- Seite 424 und 425:
nungen gleich groß ist. Lediglich
- Seite 426 und 427:
2.5 HomogenisierungDa dieses Mauerw
- Seite 428 und 429:
gleichverteilte flächenhafte Zusat
- Seite 430 und 431:
3.4 Nachweis der Erdbebensicherheit
- Seite 432 und 433:
1 EINFÜHRUNGIn den seismischen Geb
- Seite 434 und 435:
Abbildung 5: Mock-Up, AusbauAbbildu
- Seite 436 und 437:
3 SCHWINGUNGSVERHALTEN DES MOCK-UPA
- Seite 438 und 439:
dementsprechend auf eine Verdopplun
- Seite 440 und 441:
[5] C. Ebert, F.-O. Henkel: Modale
- Seite 442 und 443:
1 EINFÜHRUNGDie Bedeutung von Infr
- Seite 444 und 445:
- Erarbeitung von Schadenszenarien-
- Seite 446 und 447:
4 AKTUELLER STAND UND KONKRETE UMSE
- Seite 448 und 449:
Erdbebensicherung vonTransformatore
- Seite 450 und 451:
Vorgehensweise der StudieAls einer
- Seite 452 und 453:
5 PROBLEME UND ERFOLGSBEDINGUNGENIn
- Seite 454 und 455:
1 EINLEITUNG1.1 Hintergrund und Zie
- Seite 456 und 457:
faches von eins ausmachen [2]. Eine
- Seite 458 und 459:
1086Grundfall:MedianATC63-FF Erdbeb
- Seite 460 und 461:
dass die Grundschwingungsform linea
- Seite 462 und 463:
CC10864Median18-geschoßige RahmenC
- Seite 464 und 465:
LITERATUR[1] EC8 - ÖNORM EN 1998-1
- Seite 466 und 467:
1.00-Einführung:Die Minarett Bauwe
- Seite 468 und 469:
Die Längst-, Querschnitte sind auf
- Seite 470 und 471:
Tafel 3 Eigenformen1. MOD 2. MOD 3.
- Seite 472 und 473:
, , 0 , 0LMii BeteilungsfaktorH m
- Seite 474 und 475:
Unter der Lastwirkung P=1 müssen b
- Seite 476 und 477:
466
- Seite 478 und 479:
1 EINLEITUNGIn Kraftwerksanlagen we
- Seite 480 und 481:
- Die Extremwerte von Rissweite und
- Seite 482 und 483:
Die bemessungsrelevante Verankerung
- Seite 484 und 485:
- Die Rissweite im Beton hängt von
- Seite 486 und 487:
4.2 Zeitverläufe der AnregungEs we
- Seite 488 und 489:
Tabelle 4.1: Einflussgrößen und s
- Seite 490 und 491:
Abbildung 4.5: Histogramm und appro
- Seite 492 und 493:
482
- Seite 494 und 495:
1 EINFÜHRUNGEine wichtige Aufgabe
- Seite 496 und 497:
Wie viele Geschosse hat das Gebäud
- Seite 498 und 499:
Abbildung 3 Neues Konzept zur Ermit
- Seite 500 und 501:
ergibt. Damit können nun mit Hilfe
- Seite 502 und 503:
Abbildung 7 Verschiedene Gebäudeva
- Seite 504 und 505:
der Universität Kassel in Zusammen
- Seite 506 und 507:
496
- Seite 508 und 509:
1 EINLEITUNG1.1 Projektbeschreibung
- Seite 510 und 511:
2.2 Innere Bleche der Stahlschubwä
- Seite 512 und 513:
Verbindungsvariante Vorteile Nachte
- Seite 514 und 515:
Weg (mm)Zyklen (-)Bild 6: Zyklische
- Seite 516 und 517:
Bild 8: Versuchsaufbau und Hysteres
- Seite 518 und 519:
[2] ECCS: Recommended Testing Proce
- Seite 520 und 521:
1 EINLEITUNGMauerwerk ist seit Jahr
- Seite 522 und 523:
3 VERSTÄRKUNGSSYSTEMEZwei möglich
- Seite 524 und 525:
5 TEST AM UNVERSTÄRKTEN GEBÄUDENa
- Seite 526 und 527:
Der Rütteltischversuch wurde analo
- Seite 528 und 529:
Postersession
- Seite 530 und 531:
D-A-CH Tagung 15.-16. September 201
- Seite 532:
• Rechenmodelle zum Kapazitätsna


