agenda prospectiva de investigación y desarrollo tecnológico
agenda prospectiva de investigación y desarrollo tecnológico
agenda prospectiva de investigación y desarrollo tecnológico

You also want an ePaper? Increase the reach of your titles
YUMPU automatically turns print PDFs into web optimized ePapers that Google loves.
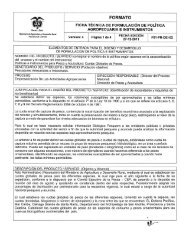
Gráfica No 2. Ten<strong>de</strong>ncia <strong>de</strong> la producción <strong>de</strong> carne bovina en los principales países 1995 – 2015<br />
Miles <strong>de</strong> Toneladas (t.e.q)<br />
14000<br />
12000<br />
10000<br />
8000<br />
6000<br />
4000<br />
2000<br />
0<br />
Consumo<br />
1995<br />
1996<br />
1997<br />
1998<br />
1999<br />
2000<br />
2001<br />
2002<br />
2003<br />
2004<br />
2005<br />
2006<br />
Fuente: GIRA Research & forescast, 2005.<br />
El consumo <strong>de</strong> carne en 2007, a nivel mundial, fue <strong>de</strong> 218 millones <strong>de</strong> toneladas. De este total,<br />
hay 100,8 millones <strong>de</strong> toneladas <strong>de</strong> carne porcina, 64.2 millones <strong>de</strong> toneladas <strong>de</strong> carne aviar y<br />
52.6 millones <strong>de</strong> toneladas <strong>de</strong> carne vacuna (46,3%, 29,5% y 24,2%, respectivamente).<br />
Durante los años <strong>de</strong> 2002 a 2007, el consumo <strong>de</strong> carne porcina fue el <strong>de</strong> mayor incremento<br />
(14,6%), en tanto que el crecimiento <strong>de</strong>l consumo <strong>de</strong> la carne vacuna fue <strong>de</strong> sólo 4,7%. Nótese<br />
que la pérdida <strong>de</strong> participación <strong>de</strong> la carne vacuna (-1,5 puntos) fue ganada prácticamente en<br />
su totalidad por el consumo <strong>de</strong> carne porcina, mientras que la participación <strong>de</strong> la carne aviar<br />
quedó igual. El cuadro 3 muestra la evolución <strong>de</strong>l consumo mundial <strong>de</strong> carne para los años<br />
2002 a 2007.<br />
Cuadro 3. Consumo mundial <strong>de</strong> carnes (millones Ton)<br />
Año<br />
Carne<br />
porcina<br />
Carne<br />
aviar<br />
Carne<br />
vacuna<br />
Total<br />
2002 87,8 57,6 50,3 195,7<br />
2003 90,3 57,7 49,1 197,0<br />
2004 92,1 58,9 49,9 200,9<br />
2005 95,2 62,1 50,9 208,2<br />
2006 98,1 63,7 51,7 213,5<br />
2007* 100,8 64,2 52,6 217,7<br />
% Crecimiento 07/02 14,8% 11,4% 4,7% 11,2%<br />
Variación absoluta 2007-2002 13,0 6.6 2.3 21,9<br />
Distribución porcentual<br />
2002<br />
2007<br />
44,9<br />
46,3<br />
29,4<br />
29,5<br />
25,7<br />
24,2<br />
100,0<br />
100,0<br />
Cambio en la participación 2007-2002 1,4<br />
* Estimado<br />
0,1 -1,5<br />
Fuente: INTA, 2007.<br />
19<br />
2007<br />
2008<br />
2009<br />
2010<br />
2011<br />
2012<br />
2013<br />
2014<br />
2015<br />
E.E.U.U.<br />
Brasil<br />
India<br />
Rusia<br />
México<br />
Europa<br />
China<br />
Argentina<br />
Australia<br />
Canadá