agenda prospectiva de investigación y desarrollo tecnológico
agenda prospectiva de investigación y desarrollo tecnológico
agenda prospectiva de investigación y desarrollo tecnológico

Create successful ePaper yourself
Turn your PDF publications into a flip-book with our unique Google optimized e-Paper software.
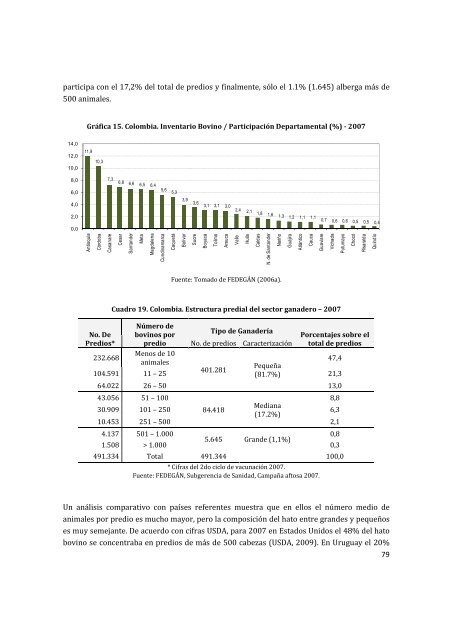
participa con el 17,2% <strong>de</strong>l total <strong>de</strong> predios y finalmente, sólo el 1.1% (1.645) alberga más <strong>de</strong><br />
500 animales.<br />
14,0<br />
12,0<br />
10,0<br />
8,0<br />
6,0<br />
4,0<br />
2,0<br />
0,0<br />
Gráfica 15. Colombia. Inventario Bovino / Participación Departamental (%) - 2007<br />
11,9<br />
Antioquia<br />
10,3<br />
Córdoba<br />
7,3<br />
Casanare<br />
No. De<br />
Predios*<br />
6,8 6,6 6,5 6,4<br />
Cesar<br />
Santan<strong>de</strong>r<br />
Meta<br />
Magdalena<br />
5,6<br />
Cundinamarca<br />
5,3<br />
Caquetá<br />
Fuente: Tomado <strong>de</strong> FEDEGÁN (2006a).<br />
Cuadro 19. Colombia. Estructura predial <strong>de</strong>l sector gana<strong>de</strong>ro – 2007<br />
Número <strong>de</strong><br />
bovinos por<br />
predio<br />
Menos <strong>de</strong> 10<br />
animales<br />
3,9<br />
Bolívar<br />
3,6<br />
Sucre<br />
3,1 3,1 3,0<br />
Boyacá<br />
Tolima<br />
2,4 2,1<br />
Tipo <strong>de</strong> Gana<strong>de</strong>ría<br />
1,8 1,6 1,3 1,2 1,1 1,1<br />
No. <strong>de</strong> predios Caracterización<br />
Porcentajes sobre el<br />
total <strong>de</strong> predios<br />
232.668<br />
47,4<br />
104.591 11 – 25<br />
401.281<br />
Pequeña<br />
(81.7%)<br />
21,3<br />
64.022 26 – 50 13,0<br />
43.056 51 – 100<br />
8,8<br />
30.909 101 – 250 84.418<br />
Mediana<br />
(17.2%)<br />
6,3<br />
10.453 251 – 500 2,1<br />
4.137 501 – 1.000<br />
0,8<br />
5.645 Gran<strong>de</strong> (1,1%)<br />
1.508 > 1.000 0,3<br />
491.334 Total 491.344 100,0<br />
Arauca<br />
* Cifras <strong>de</strong>l 2do ciclo <strong>de</strong> vacunación 2007.<br />
Fuente: FEDEGÁN, Subgerencia <strong>de</strong> Sanidad, Campaña aftosa 2007.<br />
0,7 0,6 0,6 0,5 0,5 0,4<br />
Un análisis comparativo con países referentes muestra que en ellos el número medio <strong>de</strong><br />
animales por predio es mucho mayor, pero la composición <strong>de</strong>l hato entre gran<strong>de</strong>s y pequeños<br />
es muy semejante. De acuerdo con cifras USDA, para 2007 en Estados Unidos el 48% <strong>de</strong>l hato<br />
bovino se concentraba en predios <strong>de</strong> más <strong>de</strong> 500 cabezas (USDA, 2009). En Uruguay el 20%<br />
Valle<br />
Huila<br />
Caldas<br />
N. <strong>de</strong> Santan<strong>de</strong>r<br />
Nariño<br />
Guajira<br />
Atlántico<br />
Cauca<br />
Guaviare<br />
Vichada<br />
Putumayo<br />
Chocó<br />
Risaralda<br />
Quindío<br />
79