agenda prospectiva de investigación y desarrollo tecnológico
agenda prospectiva de investigación y desarrollo tecnológico
agenda prospectiva de investigación y desarrollo tecnológico

You also want an ePaper? Increase the reach of your titles
YUMPU automatically turns print PDFs into web optimized ePapers that Google loves.
Millones <strong>de</strong> Ton.<br />
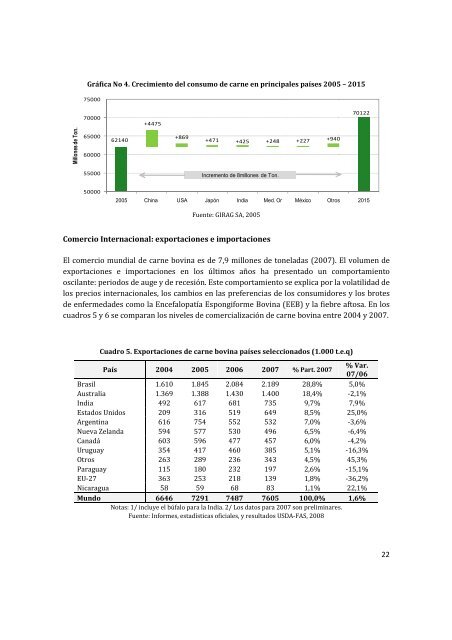
Gráfica No 4. Crecimiento <strong>de</strong>l consumo <strong>de</strong> carne en principales países 2005 – 2015<br />
75000<br />
70000<br />
65000<br />
60000<br />
55000<br />
50000<br />
62140<br />
+4475<br />
+869<br />
Fuente: GIRAG SA, 2005<br />
Comercio Internacional: exportaciones e importaciones<br />
+471 +425 +248 +227 +940<br />
Incremento <strong>de</strong> 8millones <strong>de</strong> Ton.<br />
El comercio mundial <strong>de</strong> carne bovina es <strong>de</strong> 7,9 millones <strong>de</strong> toneladas (2007). El volumen <strong>de</strong><br />
exportaciones e importaciones en los últimos años ha presentado un comportamiento<br />
oscilante: periodos <strong>de</strong> auge y <strong>de</strong> recesión. Este comportamiento se explica por la volatilidad <strong>de</strong><br />
los precios internacionales, los cambios en las preferencias <strong>de</strong> los consumidores y los brotes<br />
<strong>de</strong> enfermeda<strong>de</strong>s como la Encefalopatía Espongiforme Bovina (EEB) y la fiebre aftosa. En los<br />
cuadros 5 y 6 se comparan los niveles <strong>de</strong> comercialización <strong>de</strong> carne bovina entre 2004 y 2007.<br />
Cuadro 5. Exportaciones <strong>de</strong> carne bovina países seleccionados (1.000 t.e.q)<br />
70122<br />
2005 China USA Japón India Med. Or México Otros 2015<br />
País 2004 2005 2006 2007 % Part. 2007<br />
% Var.<br />
07/06<br />
Brasil 1.610 1.845 2.084 2.189 28,8% 5,0%<br />
Australia 1.369 1.388 1.430 1.400 18,4% -2,1%<br />
India 492 617 681 735 9,7% 7,9%<br />
Estados Unidos 209 316 519 649 8,5% 25,0%<br />
Argentina 616 754 552 532 7,0% -3,6%<br />
Nueva Zelanda 594 577 530 496 6,5% -6,4%<br />
Canadá 603 596 477 457 6,0% -4,2%<br />
Uruguay 354 417 460 385 5,1% -16,3%<br />
Otros 263 289 236 343 4,5% 45,3%<br />
Paraguay 115 180 232 197 2,6% -15,1%<br />
EU-27 363 253 218 139 1,8% -36,2%<br />
Nicaragua 58 59 68 83 1,1% 22,1%<br />
Mundo 6646 7291 7487 7605 100,0% 1,6%<br />
Notas: 1/ incluye el búfalo para la India. 2/ Los datos para 2007 son preliminares.<br />
Fuente: Informes, estadísticas oficiales, y resultados USDA-FAS, 2008<br />
22