- Page 1 and 2:
DOCUMENT DE RÉFÉRENCE 2010
- Page 4 and 5:
TABLE DES MATIÈRES Conformément
- Page 6 and 7:
19 Opérations avec des apparentés
- Page 8 and 9:
PERSONNES RESPONSABLES DU DOCUMENT
- Page 10 and 11:
2 CONTRÔLEURS LÉGAUX DES COMPTES
- Page 12 and 13:
3 INFORMATIONS FINANCIÈRES SÉLECT
- Page 14 and 15:
Bilan consolidé résumé Actif INF
- Page 16 and 17:
FACTEURS DE RISQUES 4 4.1 Risques l
- Page 18 and 19:
FACTEURS DE RISQUES Risques liés a
- Page 20 and 21:
FACTEURS DE RISQUES Risques liés a
- Page 22 and 23:
FACTEURS DE RISQUES Risques liés a
- Page 24 and 25:
FACTEURS DE RISQUES Risques liés a
- Page 26 and 27:
4.5 Gestion des risques 4.5.1 Polit
- Page 28 and 29:
Placement diversifi é des assuranc
- Page 30 and 31:
5 INFORMATIONS CONCERNANT L’ÉMET
- Page 32 and 33:
INFORMATIONS CONCERNANT L’ÉMETTE
- Page 34 and 35:
6 APERÇU DES ACTIVITÉS 6.1 Prése
- Page 36 and 37:
6.1.2 Stratégie APERÇU DES ACTIVI
- Page 38 and 39:
APERÇU DES ACTIVITÉS Présentatio
- Page 40 and 41:
■ Individuel diffus en milliers d
- Page 42 and 43:
APERÇU DES ACTIVITÉS Présentatio
- Page 44 and 45:
Les acquéreurs de logements neufs
- Page 46 and 47:
APERÇU DES ACTIVITÉS Présentatio
- Page 48 and 49:
APERÇU DES ACTIVITÉS Présentatio
- Page 50 and 51:
APERÇU DES ACTIVITÉS Description
- Page 52 and 53:
6.3.1.4 Clients APERÇU DES ACTIVIT
- Page 54 and 55:
Tous clients APERÇU DES ACTIVITÉS
- Page 56 and 57:
Activité à l’international APER
- Page 58 and 59:
6.3.1.6 Déroulement des projets et
- Page 60 and 61:
APERÇU DES ACTIVITÉS Description
- Page 62 and 63:
6.3.1.7 Commercialisation Politique
- Page 64 and 65:
APERÇU DES ACTIVITÉS Description
- Page 66 and 67:
6.3.2.2 Stratégie de développemen
- Page 68 and 69:
APERÇU DES ACTIVITÉS Description
- Page 70 and 71:
Phase de montage APERÇU DES ACTIVI
- Page 72 and 73:
6.3.2.7 Organisation opérationnell
- Page 74 and 75:
6.3.3 Services 6.3.3.1 Présentatio
- Page 76 and 77:
Gérance locative APERÇU DES ACTIV
- Page 78 and 79:
APERÇU DES ACTIVITÉS Description
- Page 80 and 81:
La société Lamy Résidences explo
- Page 82 and 83:
APERÇU DES ACTIVITÉS Description
- Page 84 and 85:
APERÇU DES ACTIVITÉS Description
- Page 86 and 87:
APERÇU DES ACTIVITÉS Concurrence
- Page 88 and 89:
6.5.4 Services Le marché des servi
- Page 90 and 91:
APERÇU DES ACTIVITÉS Environnemen
- Page 92 and 93:
APERÇU DES ACTIVITÉS Environnemen
- Page 94 and 95:
Le territoire français est découp
- Page 96 and 97:
APERÇU DES ACTIVITÉS Développeme
- Page 98 and 99:
APERÇU DES ACTIVITÉS Développeme
- Page 100 and 101:
APERÇU DES ACTIVITÉS Développeme
- Page 102 and 103:
APERÇU DES ACTIVITÉS Développeme
- Page 104 and 105:
6.7.3.2.2 Responsabilité envers le
- Page 106 and 107:
Développer les compétences des co
- Page 108 and 109:
7 ORGANIGRAMME DOCUMENT DE RÉFÉRE
- Page 110 and 111:
NEXITY SA 100 % 100 % 80 % 100 % 10
- Page 112 and 113:
PROPRIÉTÉS IMMOBILIÈRES 8 8.1 Pr
- Page 114 and 115:
9 EXAMEN DE LA SITUATION FINANCIÈR
- Page 116 and 117:
Bilan consolidé Actif EXAMEN DE LA
- Page 118 and 119:
EXAMEN DE LA SITUATION FINANCIÈRE
- Page 120 and 121:
EXAMEN DE LA SITUATION FINANCIÈRE
- Page 122 and 123:
EXAMEN DE LA SITUATION FINANCIÈRE
- Page 124 and 125:
EXAMEN DE LA SITUATION FINANCIÈRE
- Page 126 and 127:
EXAMEN DE LA SITUATION FINANCIÈRE
- Page 128 and 129:
EXAMEN DE LA SITUATION FINANCIÈRE
- Page 130 and 131:
Lotissement Nombre de réservations
- Page 132 and 133:
9.2.2 Résultat opérationnel coura
- Page 134 and 135:
9.2.2.4 Autres activités EXAMEN DE
- Page 136 and 137:
9.3.1.1 Logement EXAMEN DE LA SITUA
- Page 138 and 139:
Tertiaire Nombre de m ² EXAMEN DE
- Page 140 and 141:
9.3.2.2 Tertiaire EXAMEN DE LA SITU
- Page 142 and 143:
EXAMEN DE LA SITUATION FINANCIÈRE
- Page 144 and 145:
TRÉSORERIE ET CAPITAUX 10 10.1 Tr
- Page 146 and 147:
L’évolution du BFR par pôle est
- Page 148 and 149:
Les dettes d’acquisitions compren
- Page 150 and 151:
TRÉSORERIE ET CAPITAUX Principaux
- Page 152 and 153:
11 RECHERCHE ET DÉVELOPPEMENT, PRO
- Page 154 and 155:
12 INFORMATIONS SUR LES TENDANCES 1
- Page 156 and 157:
PRÉVISIONS OU ESTIMATIONS DU BÉN
- Page 158:
PRÉVISIONS OU ESTIMATIONS DU BÉN
- Page 161 and 162:
14 ORGANES D’ADMINISTRATION, DE D
- Page 163 and 164:
14 Nom et prénom ou dénomination
- Page 165 and 166:
14 Nom et prénom ou dénomination
- Page 167 and 168:
14 Nom et prénom ou dénomination
- Page 169 and 170:
14 Nom et prénom ou dénomination
- Page 171 and 172:
14 Nom et prénom ou dénomination
- Page 173 and 174:
14 Nom et prénom ou dénomination
- Page 175 and 176:
14 ORGANES D’ADMINISTRATION, DE D
- Page 177 and 178:
14 ORGANES D’ADMINISTRATION, DE D
- Page 179 and 180:
178 DOCUMENT DE RÉFÉRENCE 2010
- Page 181 and 182:
15 RÉMUNÉRATION ET AVANTAGES DES
- Page 183 and 184:
15 RÉMUNÉRATION ET AVANTAGES DES
- Page 185 and 186:
15 RÉMUNÉRATION ET AVANTAGES DES
- Page 187 and 188:
16 FONCTIONNEMENT DES ORGANES D’A
- Page 189 and 190:
16 FONCTIONNEMENT DES ORGANES D’A
- Page 191 and 192:
16 FONCTIONNEMENT DES ORGANES D’A
- Page 193 and 194:
192 DOCUMENT DE RÉFÉRENCE 2010
- Page 195 and 196:
17 SALARIÉS - RESSOURCES HUMAINES
- Page 197 and 198:
17 SALARIÉS - RESSOURCES HUMAINES
- Page 199 and 200:
17 SALARIÉS - RESSOURCES HUMAINES
- Page 201 and 202:
17 SALARIÉS - RESSOURCES HUMAINES
- Page 203 and 204:
17 SALARIÉS - RESSOURCES HUMAINES
- Page 205 and 206:
17 SALARIÉS - RESSOURCES HUMAINES
- Page 207 and 208:
17 SALARIÉS - RESSOURCES HUMAINES
- Page 209 and 210:
17 SALARIÉS - RESSOURCES HUMAINES
- Page 211 and 212:
17 SALARIÉS - RESSOURCES HUMAINES
- Page 213 and 214:
18 PRINCIPAUX ACTIONNAIRES Actionna
- Page 215 and 216:
18 PRINCIPAUX ACTIONNAIRES Actionna
- Page 217 and 218:
216 DOCUMENT DE RÉFÉRENCE 2010
- Page 219 and 220:
19 OPÉRATIONS AVEC DES APPARENTÉS
- Page 221 and 222:
20 INFORMATIONS FINANCIÈRES CONCER
- Page 223 and 224:
20 INFORMATIONS FINANCIÈRES CONCER
- Page 225 and 226:
20 INFORMATIONS FINANCIÈRES CONCER
- Page 227 and 228:
226 DOCUMENT DE RÉFÉRENCE 2010
- Page 229 and 230:
21 INFORMATIONS COMPLÉMENTAIRES CO
- Page 231 and 232:
21 INFORMATIONS COMPLÉMENTAIRES CO
- Page 233 and 234:
21 INFORMATIONS COMPLÉMENTAIRES CO
- Page 235 and 236:
21 INFORMATIONS COMPLÉMENTAIRES CO
- Page 237 and 238:
21 INFORMATIONS COMPLÉMENTAIRES CO
- Page 239 and 240:
22 CONTRATS IMPORTANTS Coopération
- Page 241 and 242:
23 INFORMATIONS PROVENANT DE TIERS,
- Page 243 and 244:
24 DOCUMENTS ACCESSIBLES AU PUBLIC
- Page 245 and 246:
25 INFORMATIONS SUR LES PARTICIPATI
- Page 247 and 248:
A ANNEXES 246 DOCUMENT DE RÉFÉREN
- Page 249 and 250:
1 ANNEXE États fi nanciers consoli
- Page 251 and 252:
1 ANNEXE États fi nanciers consoli
- Page 253 and 254:
1 ANNEXE États fi nanciers consoli
- Page 255 and 256:
1 ANNEXE États fi nanciers consoli
- Page 257 and 258:
1 ANNEXE États fi nanciers consoli
- Page 259 and 260:
1 ANNEXE États fi nanciers consoli
- Page 261 and 262:
1 ANNEXE États fi nanciers consoli
- Page 263 and 264:
1 ANNEXE États fi nanciers consoli
- Page 265 and 266:
1 ANNEXE États fi nanciers consoli
- Page 267 and 268:
1 ANNEXE États fi nanciers consoli
- Page 269 and 270:
1 ANNEXE États fi nanciers consoli
- Page 271 and 272:
1 ANNEXE États fi nanciers consoli
- Page 273 and 274:
1 ANNEXE États fi nanciers consoli
- Page 275 and 276:
1 ANNEXE États fi nanciers consoli
- Page 277 and 278:
1 ANNEXE États fi nanciers consoli
- Page 279 and 280:
1 ANNEXE États fi nanciers consoli
- Page 281 and 282:
1 ANNEXE États fi nanciers consoli
- Page 283 and 284:
1 ANNEXE États fi nanciers consoli
- Page 285 and 286:
1 ANNEXE États fi nanciers consoli
- Page 287 and 288:
1 ANNEXE États fi nanciers consoli
- Page 289 and 290:
1 ANNEXE États fi nanciers consoli
- Page 291 and 292:
1 ANNEXE États fi nanciers consoli
- Page 293 and 294:
1 ANNEXE États fi nanciers consoli
- Page 295 and 296:
1 ANNEXE États fi nanciers consoli
- Page 297 and 298:
1 ANNEXE États fi nanciers consoli
- Page 299 and 300: 1 ANNEXE États fi nanciers consoli
- Page 301 and 302: 1 ANNEXE États fi nanciers consoli
- Page 303 and 304: 1 ANNEXE États fi nanciers consoli
- Page 305 and 306: 1 ANNEXE États fi nanciers consoli
- Page 307 and 308: 1 ANNEXE États fi nanciers consoli
- Page 309 and 310: 1 ANNEXE États fi nanciers consoli
- Page 311 and 312: 1 ANNEXE États fi nanciers consoli
- Page 313 and 314: 1 ANNEXE États fi nanciers consoli
- Page 315 and 316: 1 ANNEXE Rapport des Commissaires a
- Page 317 and 318: 316 DOCUMENT DE RÉFÉRENCE 2010
- Page 319 and 320: 2 ANNEXE Rapport spécial des Commi
- Page 321 and 322: 2 ANNEXE Rapport spécial des Commi
- Page 323 and 324: 2 ANNEXE Rapport spécial des Commi
- Page 325 and 326: 2 ANNEXE Rapport spécial des Commi
- Page 327 and 328: 3 ANNEXE Rapport du Président du C
- Page 329 and 330: 3 ANNEXE Rapport du Président du C
- Page 331 and 332: 3 ANNEXE Rapport du Président du C
- Page 333 and 334: 3 ANNEXE Rapport du Président du C
- Page 335 and 336: 3 ANNEXE Rapport du Président du C
- Page 337 and 338: 3 ANNEXE Rapport du Président du C
- Page 339 and 340: 3 ANNEXE Rapport du Président du C
- Page 341 and 342: 3 ANNEXE Rapport du Président du C
- Page 343 and 344: 3 ANNEXE Rapport du Président du C
- Page 345 and 346: 3 ANNEXE Rapport du Président du C
- Page 347 and 348: 3 ANNEXE Rapport des Commissaires a
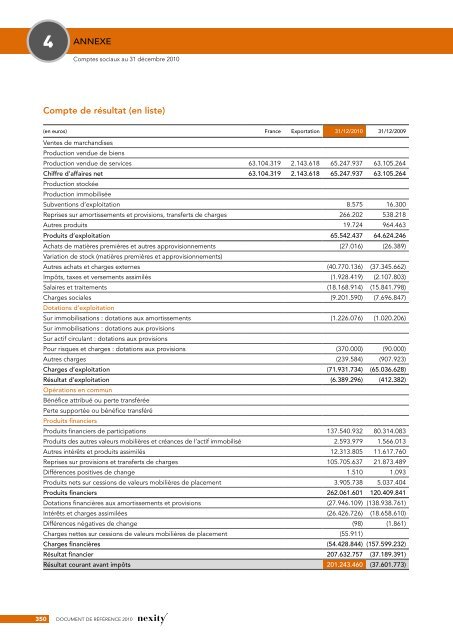
- Page 349: 4 ANNEXE Bilan Actif Comptes sociau
- Page 353 and 354: 4 ANNEXE Notes aux comptes sociaux
- Page 355 and 356: 4 ANNEXE Notes aux comptes sociaux
- Page 357 and 358: 4 ANNEXE Notes aux comptes sociaux
- Page 359 and 360: 4 ANNEXE Notes aux comptes sociaux
- Page 361 and 362: 4 ANNEXE Notes aux comptes sociaux
- Page 363 and 364: 4 ANNEXE Notes aux comptes sociaux
- Page 365 and 366: 4 ANNEXE Notes aux comptes sociaux
- Page 367 and 368: 4 ANNEXE Notes aux comptes sociaux
- Page 369 and 370: 4 ANNEXE Notes aux comptes sociaux
- Page 371 and 372: 4 ANNEXE Rapport des Commissaires a
- Page 373 and 374: 5 ANNEXE 5 Table des concordances a
- Page 375: 1, terrasse Bellini TSA 48200 92919