- Page 3:
l’aumento dei controlli su strada
- Page 7 and 8:
PARTE SECONDA: PROGRAMMAZIONE EDORG
- Page 9 and 10:
PARTE SESTA: INDICAZIONI GENERALIVI
- Page 11 and 12:
volontariato, del lavoro e delle im
- Page 14 and 15:
SINTESI DELLA RELAZIONE ANNUALE AL
- Page 16 and 17:
DIPARTIMENTO POLITICHE ANTIDROGAFig
- Page 18 and 19:
DIPARTIMENTO POLITICHE ANTIDROGAI.2
- Page 20 and 21:
DIPARTIMENTO POLITICHE ANTIDROGALe
- Page 22 and 23:
DIPARTIMENTO POLITICHE ANTIDROGAera
- Page 24:
DIPARTIMENTO POLITICHE ANTIDROGAdel
- Page 28:
CAPITOLO I.1.CONSUMO DI DROGAI.1.1.
- Page 31 and 32:
RELAZIONE AL PARLAMENTO SULLE TOSSI
- Page 33 and 34:
RELAZIONE AL PARLAMENTO SULLE TOSSI
- Page 35 and 36:
RELAZIONE AL PARLAMENTO SULLE TOSSI
- Page 37 and 38:
Prevalenza (%)RELAZIONE AL PARLAMEN
- Page 39 and 40:
Prevalenza (%)RELAZIONE AL PARLAMEN
- Page 41 and 42:
Prevalenza (%)RELAZIONE AL PARLAMEN
- Page 43 and 44:
Prevalenza (%)RELAZIONE AL PARLAMEN
- Page 45 and 46:
Prevalenza (%)RELAZIONE AL PARLAMEN
- Page 47 and 48:
RELAZIONE AL PARLAMENTO SULLE TOSSI
- Page 49 and 50:
RELAZIONE AL PARLAMENTO SULLE TOSSI
- Page 51 and 52:
RELAZIONE AL PARLAMENTO SULLE TOSSI
- Page 53 and 54:
Prevalenza (%)Prevalenza (%)RELAZIO
- Page 55 and 56:
Prevalenza (%)Prevalenza (%)RELAZIO
- Page 57 and 58: Prevalenza (%)RELAZIONE AL PARLAMEN
- Page 59 and 60: Prevalenza (%)RELAZIONE AL PARLAMEN
- Page 61 and 62: Prevalenza (%)Prevalenza (%)RELAZIO
- Page 63 and 64: Prevalenza (%)RELAZIONE AL PARLAMEN
- Page 65 and 66: Prevalenza (%)RELAZIONE AL PARLAMEN
- Page 67 and 68: RELAZIONE AL PARLAMENTO SULLE TOSSI
- Page 69 and 70: RELAZIONE AL PARLAMENTO SULLE TOSSI
- Page 71 and 72: RELAZIONE AL PARLAMENTO SULLE TOSSI
- Page 73 and 74: RELAZIONE AL PARLAMENTO SULLE TOSSI
- Page 76: CAPITOLO I.2.SOGGETTI CON BISOGNO D
- Page 79 and 80: Prevalenza per 1.000 residentiRELAZ
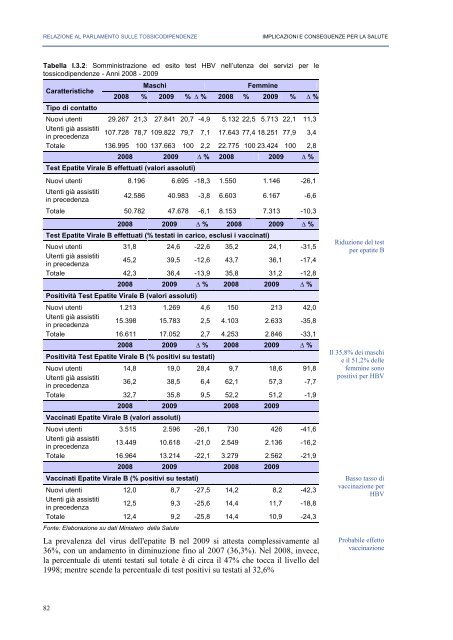
- Page 81 and 82: RELAZIONE AL PARLAMENTO SULLE TOSSI
- Page 83 and 84: numero richiesteRELAZIONE AL PARLAM
- Page 85 and 86: RELAZIONE AL PARLAMENTO SULLE TOSSI
- Page 87 and 88: RELAZIONE AL PARLAMENTO SULLE TOSSI
- Page 89 and 90: Utenti in trattamentoRELAZIONE AL P
- Page 91 and 92: RELAZIONE AL PARLAMENTO SULLE TOSSI
- Page 93 and 94: RELAZIONE AL PARLAMENTO SULLE TOSSI
- Page 95 and 96: (%)RELAZIONE AL PARLAMENTO SULLE TO
- Page 97 and 98: RELAZIONE AL PARLAMENTO SULLE TOSSI
- Page 99 and 100: RELAZIONE AL PARLAMENTO SULLE TOSSI
- Page 102 and 103: DIPARTIMENTO POLITICHE ANTIDROGAI.3
- Page 104 and 105: (%)DIPARTIMENTO POLITICHE ANTIDROGA
- Page 106 and 107: (%)DIPARTIMENTO POLITICHE ANTIDROGA
- Page 110 and 111: (%)(%)DIPARTIMENTO POLITICHE ANTIDR
- Page 112 and 113: DIPARTIMENTO POLITICHE ANTIDROGAFig
- Page 114 and 115: (%)DIPARTIMENTO POLITICHE ANTIDROGA
- Page 116 and 117: DIPARTIMENTO POLITICHE ANTIDROGAFig
- Page 118 and 119: DIPARTIMENTO POLITICHE ANTIDROGAI.3
- Page 120 and 121: DIPARTIMENTO POLITICHE ANTIDROGAFig
- Page 122 and 123: DIPARTIMENTO POLITICHE ANTIDROGAtos
- Page 124 and 125: DIPARTIMENTO POLITICHE ANTIDROGAed
- Page 126 and 127: DIPARTIMENTO POLITICHE ANTIDROGAFig
- Page 128 and 129: DIPARTIMENTO POLITICHE ANTIDROGATab
- Page 130 and 131: DIPARTIMENTO POLITICHE ANTIDROGAI.3
- Page 132 and 133: DIPARTIMENTO POLITICHE ANTIDROGANel
- Page 134 and 135: DIPARTIMENTO POLITICHE ANTIDROGAcoc
- Page 136: CAPITOLO I.4.IMPLICAZIONI SOCIALII.
- Page 139 and 140: (%)RELAZIONE AL PARLAMENTO SULLE TO
- Page 141 and 142: RELAZIONE AL PARLAMENTO SULLE TOSSI
- Page 143 and 144: RELAZIONE AL PARLAMENTO SULLE TOSSI
- Page 145: RELAZIONE AL PARLAMENTO SULLE TOSSI
- Page 148 and 149: DIPARTIMENTO POLITICHE ANTIDROGATab
- Page 150 and 151: DIPARTIMENTO POLITICHE ANTIDROGAI.4
- Page 152 and 153: (%)DIPARTIMENTO POLITICHE ANTIDROGA
- Page 154: CAPITOLO I.5.MERCATO DELLA DROGAI.5
- Page 157 and 158: RELAZIONE AL PARLAMENTO SULLE TOSSI
- Page 159 and 160:
RELAZIONE AL PARLAMENTO SULLE TOSSI
- Page 161 and 162:
RELAZIONE AL PARLAMENTO SULLE TOSSI
- Page 163 and 164:
RELAZIONE AL PARLAMENTO SULLE TOSSI
- Page 166:
CAPITOLO II.1.POLITICHE SULLE DROGH
- Page 169 and 170:
RELAZIONE AL PARLAMENTO SULLE TOSSI
- Page 171 and 172:
Recepimentonormativa nazionaleprogr
- Page 173 and 174:
RELAZIONE AL PARLAMENTO SULLE TOSSI
- Page 175 and 176:
RELAZIONE AL PARLAMENTO SULLE TOSSI
- Page 178 and 179:
DIPARTIMENTO POLITICHE ANTIDROGAII.
- Page 180 and 181:
DIPARTIMENTO POLITICHE ANTIDROGArig
- Page 182 and 183:
DIPARTIMENTO POLITICHE ANTIDROGAstu
- Page 184 and 185:
DIPARTIMENTO POLITICHE ANTIDROGAimm
- Page 186 and 187:
DIPARTIMENTO POLITICHE ANTIDROGAFig
- Page 188 and 189:
DIPARTIMENTO POLITICHE ANTIDROGAII.
- Page 190 and 191:
DIPARTIMENTO POLITICHE ANTIDROGAcar
- Page 192 and 193:
NATIONAL EARLY WARNING SYSTEMDIPART
- Page 194 and 195:
DIPARTIMENTO POLITICHE ANTIDROGAten
- Page 196 and 197:
NATIONAL EARLY WARNING SYSTEMDIPART
- Page 198 and 199:
DIPARTIMENTO POLITICHE ANTIDROGAFig
- Page 200 and 201:
DIPARTIMENTO POLITICHE ANTIDROGApre
- Page 202 and 203:
DIPARTIMENTO POLITICHE ANTIDROGATra
- Page 204 and 205:
DIPARTIMENTO POLITICHE ANTIDROGAII.
- Page 206 and 207:
DIPARTIMENTO POLITICHE ANTIDROGAFig
- Page 208 and 209:
DIPARTIMENTO POLITICHE ANTIDROGAFig
- Page 210:
DIPARTIMENTO POLITICHE ANTIDROGAdia
- Page 214:
CAPITOLO III.1.PREVENZIONEIII.1.1.
- Page 217 and 218:
RELAZIONE AL PARLAMENTO SULLE TOSSI
- Page 219 and 220:
RELAZIONE AL PARLAMENTO SULLE TOSSI
- Page 221 and 222:
RELAZIONE AL PARLAMENTO SULLE TOSSI
- Page 223 and 224:
RELAZIONE AL PARLAMENTO SULLE TOSSI
- Page 225 and 226:
RELAZIONE AL PARLAMENTO SULLE TOSSI
- Page 228 and 229:
DIPARTIMENTO POLITICHE ANTIDROGAIII
- Page 230 and 231:
Percentuale soggetti trattatiPercen
- Page 232 and 233:
(%)(%)DIPARTIMENTO POLITICHE ANTIDR
- Page 234 and 235:
Percentuale soggetti trattatiDIPART
- Page 236 and 237:
DIPARTIMENTO POLITICHE ANTIDROGAFig
- Page 238 and 239:
DIPARTIMENTO POLITICHE ANTIDROGA40
- Page 240:
CAPITOLO III.3.INTERVENTI DI PREVEN
- Page 243 and 244:
RELAZIONE AL PARLAMENTO SULLE TOSSI
- Page 245 and 246:
RELAZIONE AL PARLAMENTO SULLE TOSSI
- Page 247 and 248:
RELAZIONE AL PARLAMENTO SULLE TOSSI
- Page 249 and 250:
RELAZIONE AL PARLAMENTO SULLE TOSSI
- Page 251 and 252:
RELAZIONE AL PARLAMENTO SULLE TOSSI
- Page 253 and 254:
RELAZIONE AL PARLAMENTO SULLE TOSSI
- Page 255 and 256:
RELAZIONE AL PARLAMENTO SULLE TOSSI
- Page 257 and 258:
Persone con procedimenti pendentiRE
- Page 259 and 260:
etàRELAZIONE AL PARLAMENTO SULLE T
- Page 261 and 262:
RELAZIONE AL PARLAMENTO SULLE TOSSI
- Page 263 and 264:
RELAZIONE AL PARLAMENTO SULLE TOSSI
- Page 265 and 266:
RELAZIONE AL PARLAMENTO SULLE TOSSI
- Page 268 and 269:
DIPARTIMENTO POLITICHE ANTIDROGAIII
- Page 270 and 271:
DIPARTIMENTO POLITICHE ANTIDROGAIII
- Page 272 and 273:
DIPARTIMENTO POLITICHE ANTIDROGAsta
- Page 274 and 275:
DIPARTIMENTO POLITICHE ANTIDROGAFig
- Page 276 and 277:
DIPARTIMENTO POLITICHE ANTIDROGAFig
- Page 278 and 279:
DIPARTIMENTO POLITICHE ANTIDROGAFig
- Page 280 and 281:
(%)DIPARTIMENTO POLITICHE ANTIDROGA
- Page 282:
Parte QuartaApprofondimenti
- Page 286 and 287:
DIPARTIMENTO POLITICHE ANTIDROGAIV.
- Page 288 and 289:
DIPARTIMENTO POLITICHE ANTIDROGAFig
- Page 290 and 291:
DIPARTIMENTO POLITICHE ANTIDROGAFig
- Page 292 and 293:
DIPARTIMENTO POLITICHE ANTIDROGAalt
- Page 294:
CAPITOLO IV.2.STIMA DEI CONSUMI DI
- Page 297 and 298:
RELAZIONE AL PARLAMENTO SULLE TOSSI
- Page 299 and 300:
RELAZIONE AL PARLAMENTO SULLE TOSSI
- Page 301 and 302:
RELAZIONE AL PARLAMENTO SULLE TOSSI
- Page 303 and 304:
RELAZIONE AL PARLAMENTO SULLE TOSSI
- Page 306 and 307:
DIPARTIMENTO POLITICHE ANTIDROGAIV.
- Page 308 and 309:
DIPARTIMENTO POLITICHE ANTIDROGAFig
- Page 310 and 311:
DIPARTIMENTO POLITICHE ANTIDROGAdi
- Page 312 and 313:
DIPARTIMENTO POLITICHE ANTIDROGAdec
- Page 314:
CAPITOLO IV.4.IL PROGETTO “DRUGS
- Page 317 and 318:
RELAZIONE AL PARLAMENTO SULLE TOSSI
- Page 319 and 320:
RELAZIONE AL PARLAMENTO SULLE TOSSI
- Page 321 and 322:
RELAZIONE AL PARLAMENTO SULLE TOSSI
- Page 323 and 324:
RELAZIONE AL PARLAMENTO SULLE TOSSI
- Page 326 and 327:
DIPARTIMENTO POLITICHE ANTIDROGAIV.
- Page 328 and 329:
DIPARTIMENTO POLITICHE ANTIDROGAche
- Page 330 and 331:
DIPARTIMENTO POLITICHE ANTIDROGAcon
- Page 332 and 333:
DIPARTIMENTO POLITICHE ANTIDROGAIV.
- Page 334 and 335:
DIPARTIMENTO POLITICHE ANTIDROGAIV.
- Page 336:
CAPITOLO IV.6.STUDIO PRELIMINARE PE
- Page 339 and 340:
RELAZIONE AL PARLAMENTO SULLE TOSSI
- Page 341 and 342:
RELAZIONE AL PARLAMENTO SULLE TOSSI
- Page 343 and 344:
RELAZIONE AL PARLAMENTO SULLE TOSSI
- Page 345 and 346:
RELAZIONE AL PARLAMENTO SULLE TOSSI
- Page 347 and 348:
RELAZIONE AL PARLAMENTO SULLE TOSSI
- Page 349 and 350:
RELAZIONE AL PARLAMENTO SULLE TOSSI
- Page 352 and 353:
CAPITOLO V.1.MINISTERIV.1.1. Coordi
- Page 354 and 355:
DIPARTIMENTO POLITICHE ANTIDROGAV.1
- Page 356 and 357:
DIPARTIMENTO POLITICHE ANTIDROGA- P
- Page 358 and 359:
DIPARTIMENTO POLITICHE ANTIDROGAl
- Page 360 and 361:
DIPARTIMENTO POLITICHE ANTIDROGAcon
- Page 362 and 363:
DIPARTIMENTO POLITICHE ANTIDROGANaz
- Page 364 and 365:
DIPARTIMENTO POLITICHE ANTIDROGAè
- Page 366 and 367:
DIPARTIMENTO POLITICHE ANTIDROGAe r
- Page 368 and 369:
DIPARTIMENTO POLITICHE ANTIDROGAV.1
- Page 370 and 371:
DIPARTIMENTO POLITICHE ANTIDROGA"fo
- Page 372 and 373:
DIPARTIMENTO POLITICHE ANTIDROGAcon
- Page 374 and 375:
DIPARTIMENTO POLITICHE ANTIDROGAfar
- Page 376 and 377:
Capitolo V.2.REGIONIV.2.1. Indicato
- Page 378 and 379:
DIPARTIMENTO POLITICHE ANTIDROGAV.2
- Page 380 and 381:
DIPARTIMENTO POLITICHE ANTIDROGAV.2
- Page 382 and 383:
DIPARTIMENTO POLITICHE ANTIDROGAV.2
- Page 384 and 385:
DIPARTIMENTO POLITICHE ANTIDROGAV.2
- Page 386 and 387:
DIPARTIMENTO POLITICHE ANTIDROGAV.2
- Page 388 and 389:
DIPARTIMENTO POLITICHE ANTIDROGAV.2
- Page 390 and 391:
DIPARTIMENTO POLITICHE ANTIDROGAV.2
- Page 392 and 393:
DIPARTIMENTO POLITICHE ANTIDROGAV.2
- Page 394 and 395:
DIPARTIMENTO POLITICHE ANTIDROGAV.2
- Page 396 and 397:
DIPARTIMENTO POLITICHE ANTIDROGAV.2
- Page 398 and 399:
DIPARTIMENTO POLITICHE ANTIDROGAV.2
- Page 400 and 401:
DIPARTIMENTO POLITICHE ANTIDROGAV.2
- Page 402 and 403:
DIPARTIMENTO POLITICHE ANTIDROGAV.2
- Page 404 and 405:
DIPARTIMENTO POLITICHE ANTIDROGAV.2
- Page 406 and 407:
DIPARTIMENTO POLITICHE ANTIDROGAV.2
- Page 408 and 409:
DIPARTIMENTO POLITICHE ANTIDROGAV.2
- Page 410 and 411:
DIPARTIMENTO POLITICHE ANTIDROGAV.2
- Page 412 and 413:
DIPARTIMENTO POLITICHE ANTIDROGAV.2
- Page 414 and 415:
DIPARTIMENTO POLITICHE ANTIDROGAV.2
- Page 416 and 417:
DIPARTIMENTO POLITICHE ANTIDROGAV.2
- Page 418 and 419:
DIPARTIMENTO POLITICHE ANTIDROGAV.2
- Page 420 and 421:
DIPARTIMENTO POLITICHE ANTIDROGAV.2
- Page 422 and 423:
DIPARTIMENTO POLITICHE ANTIDROGATab
- Page 424 and 425:
DIPARTIMENTO POLITICHE ANTIDROGAR.C
- Page 426 and 427:
DIPARTIMENTO POLITICHE ANTIDROGAR.C
- Page 428 and 429:
DIPARTIMENTO POLITICHE ANTIDROGACon
- Page 430 and 431:
DIPARTIMENTO POLITICHE ANTIDROGAFig
- Page 432 and 433:
DIPARTIMENTO POLITICHE ANTIDROGAFig
- Page 434 and 435:
DIPARTIMENTO POLITICHE ANTIDROGANaz
- Page 436 and 437:
DIPARTIMENTO POLITICHE ANTIDROGA- l
- Page 438 and 439:
DIPARTIMENTO POLITICHE ANTIDROGAIn
- Page 440 and 441:
DIPARTIMENTO POLITICHE ANTIDROGAloc
- Page 442 and 443:
DIPARTIMENTO POLITICHE ANTIDROGAscu
- Page 444 and 445:
DIPARTIMENTO POLITICHE ANTIDROGALe
- Page 446 and 447:
DIPARTIMENTO POLITICHE ANTIDROGAV.2
- Page 448 and 449:
DIPARTIMENTO POLITICHE ANTIDROGAdel
- Page 450 and 451:
DIPARTIMENTO POLITICHE ANTIDROGAass
- Page 452 and 453:
DIPARTIMENTO POLITICHE ANTIDROGAV.2
- Page 454 and 455:
DIPARTIMENTO POLITICHE ANTIDROGAdel
- Page 456 and 457:
DIPARTIMENTO POLITICHE ANTIDROGA- d
- Page 458 and 459:
DIPARTIMENTO POLITICHE ANTIDROGAB)
- Page 460 and 461:
DIPARTIMENTO POLITICHE ANTIDROGAla
- Page 462 and 463:
DIPARTIMENTO POLITICHE ANTIDROGAV.2
- Page 464 and 465:
DIPARTIMENTO POLITICHE ANTIDROGAd'i
- Page 466 and 467:
DIPARTIMENTO POLITICHE ANTIDROGAimp
- Page 468 and 469:
DIPARTIMENTO POLITICHE ANTIDROGAcon
- Page 470 and 471:
DIPARTIMENTO POLITICHE ANTIDROGAvig
- Page 472:
Parte SestaIndicazioni generali
- Page 475 and 476:
RELAZIONE AL PARLAMENTO SULLE TOSSI
- Page 477 and 478:
RELAZIONE AL PARLAMENTO SULLE TOSSI
- Page 479 and 480:
RELAZIONE AL PARLAMENTO SULLE TOSSI
- Page 481 and 482:
RELAZIONE AL PARLAMENTO SULLE TOSSI
- Page 483 and 484:
RELAZIONE AL PARLAMENTO SULLE TOSSI
- Page 485 and 486:
RELAZIONE AL PARLAMENTO SULLE TOSSI
- Page 487 and 488:
RELAZIONE AL PARLAMENTO SULLE TOSSI