Relationship Equity im Private Banking - Universität St.Gallen
Relationship Equity im Private Banking - Universität St.Gallen
Relationship Equity im Private Banking - Universität St.Gallen

Sie wollen auch ein ePaper? Erhöhen Sie die Reichweite Ihrer Titel.
YUMPU macht aus Druck-PDFs automatisch weboptimierte ePaper, die Google liebt.
R E L A T I O N S H I P E Q U I T Y I M P R I V A T E B A N K I N G<br />
Section B: Digging Into the Depth of the Client Clusters<br />
1. Customizable CLIENT-O-METER 1 dot = 1 client 2. <strong>Relationship</strong> equity statement<br />
120<br />
100<br />
Unit: CHFmn (CHFk for individual client level)<br />
Client growth potential<br />
2005_Q1<br />
Client population focussed<br />
All Cluster % Indiv % Clust<br />
+ NPV organic development, gross 103.5 0% 36 0%<br />
./. NPV expected client attrition -6.5 0.0 0% 0 0%<br />
= NPV organic development, net 97.0 0% 36 0%<br />
Client age (years)<br />
80<br />
60<br />
40<br />
20<br />
0<br />
0 2'000 4'000 6'000 8'000 10'000 12'000 14'000 16'000<br />
+ NPV share of wallet potential* 12.8 0% 12 0%<br />
+ NPV pricing potential* 0.2 0% 0 0%<br />
+ NPV liability potential* 5.0 0% 1 0%<br />
= NPV anorganic development* 18.0 0.0 0% 13 0%<br />
NPV share of wallet potential vs target 0% 15 0%<br />
Max<strong>im</strong>um directly capturable value 115.0 0% 49 0%<br />
+ Exp. inheritances (from outside of bank) 3.4 0% 0 0%<br />
+ Exp. inheritances (from within bank) 4'286.4 0% 0 0%<br />
= Total indirect new money benefit 4'289.8 0% 0 0%<br />
Outflow risk<br />
NPV of potential legacy out 26.7 0% 61 0%<br />
NPV of potential legacy out (unsecured) 12.5 0% 61 0%<br />
p.m. NPV expected client attrition 6.5 0.0 0% 0 0%<br />
Total wealth (CHFk)<br />
3. Expected value capturing periods by client cluster 1 dot = 1 cluster<br />
40%<br />
Highest value share<br />
Current filter settings NAV PAD<br />
Retired (65+) 30%<br />
Explicit organic value share<br />
GENERAL SETTINGS<br />
30%<br />
4.2<br />
Lowest value share<br />
CUSTOM IZE!<br />
Market: all <strong>St</strong>udent with potential 0.7%<br />
Income/wealth bracket: all / all<br />
20%<br />
Sex: both 0 A B C<br />
Highest duration (years)<br />
<strong>St</strong>udent with potential 5.0<br />
10%<br />
SECTION B SETTINGS Lowest duration (years)<br />
Cluster: all Professional (-30) 2.7<br />
No. of selected clients: 1'000 0%<br />
Total duration (years)<br />
Client number selected: 0 0 1 2 3 4 5 6 All clusters 4.2<br />
* in relation to cluster average Years until capturing of 50% of explicit organic value<br />
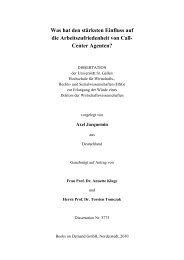
Abbildung 6-16: Visualisierung der Kundenwerthaltigkeit <strong>im</strong> Cockpit<br />
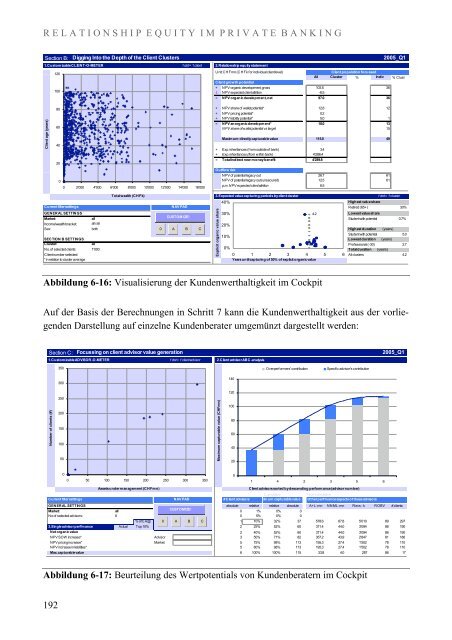
Auf der Basis der Berechnungen in Schritt 7 kann die Kundenwerthaltigkeit aus der vorliegenden<br />
Darstellung auf einzelne Kundenberater umgemünzt dargestellt werden:<br />
Section C: Focussing on client advisor value generation<br />
1. Customizable ADVISOR-O-METER 1 dot = 1 client advisor 2. Client advisor ABC-analysis<br />
2005_Q1<br />
350<br />
Overperformers' contribution<br />
Specific advisor's contribution<br />
300<br />
140<br />
120<br />
250<br />
Number of clients (#)<br />
200<br />
150<br />
100<br />
50<br />
Max<strong>im</strong>um capturable value (CHFmn)<br />
100<br />
80<br />
60<br />
40<br />
20<br />
0<br />
0 50 100 150 200 250 300 350<br />
Assets under management (CHFmn)<br />
Client advisors sorted by descending performance (advisor number)<br />
Cumulative<br />
Non-cumulative<br />
Current filter settings NAV PAD<br />
# Client advisors Max<strong>im</strong>um capturable value Other perf'mance aspects of these advisors<br />
GENERAL SETTINGS absolute relative relative absolute A+L -mn NNML -mn Revs - k ROBV # clients<br />
Market: all<br />
CUSTOMIZE!<br />
0 1% 0% 0 0.0 0.0 0 0 0<br />
No of selected advisors: 6 0 5% 0% 0 0.0 0.0 0 0 0<br />
%ofCA@ 0 A B C<br />
1 10% 32% 37 578.6 67.8 5'010 89 297<br />
3. Single advisor perf'mance Actual Top 10% 2 25% 52% 60 371.4 44.0 3'094 86 190<br />
Net organic value 0.0 0% 2 40% 52% 60 371.4 44.0 3'094 86 190<br />
NPV SOW increase* 0.0 0% Advisor 0<br />
3 50% 71% 82 357.2 43.9 2'847 81 186<br />
NPV pricing increase* 0.0 0% Market 0<br />
5 75% 98% 113 195.3 27.4 1'502 78 110<br />
NPV increase in liabilities* 0.0 0% 5 80% 98% 113 195.3 27.4 1'502 78 110<br />
Max. capturable value 0.0 0% 6 100% 100% 115 33.8 4.0 287 86 17<br />
0<br />
1 4 2 3 5 6<br />
Abbildung 6-17: Beurteilung des Wertpotentials von Kundenberatern <strong>im</strong> Cockpit<br />
192