Manual sobre las metodologÃas para la recolección de datos a
Manual sobre las metodologÃas para la recolección de datos a
Manual sobre las metodologÃas para la recolección de datos a

Create successful ePaper yourself
Turn your PDF publications into a flip-book with our unique Google optimized e-Paper software.
II.6 DISEÑO MUESTRAL 201<br />
Ejemplo: Tab<strong>la</strong> 4<br />
2 a muestra (ENT)<br />
f final =<br />
f0*f1*f2<br />
pon<strong>de</strong>ración<br />
<strong>de</strong>l diseño<br />
α 1/f<br />
9<br />
62<br />
91<br />
…<br />
8<br />
16<br />
2<br />
…<br />
69<br />
32<br />
18<br />
…<br />
60<br />
96<br />
65<br />
94<br />
73<br />
78<br />
84<br />
89<br />
86<br />
92<br />
93<br />
97<br />
…<br />
0.019<br />
0.020<br />
0.021<br />
…<br />
0.039<br />
0.039<br />
0.039<br />
…<br />
0.039<br />
0.039<br />
0.039<br />
0.039<br />
0.039<br />
0.039<br />
0.039<br />
0.039<br />
0.039<br />
0.039<br />
0.039<br />
0.039<br />
áreas. Las áreas con (c i<br />
/p i<br />
)>I se mantienen en <strong>la</strong> segunda muestra con probabilidad 1,0 (un<br />
total <strong>de</strong> 18 áreas resultó ser «muy gran<strong>de</strong>» en este sentido; véanse <strong><strong>la</strong>s</strong> tab<strong><strong>la</strong>s</strong> <strong>de</strong>l anexo). Para<br />
estas áreas, c i<br />
se re<strong>de</strong>fine como c’ i<br />
= I * p i<br />
(tab<strong>la</strong> 2, Col.[7]) <strong>para</strong> asegurar que <strong>la</strong> probabilidad<br />
<strong>de</strong> selección no exceda 1,0. Las probabilida<strong>de</strong>s finales <strong>de</strong> selección <strong>de</strong> <strong><strong>la</strong>s</strong> áreas <strong>de</strong> <strong>la</strong> muestra<br />
1 a <strong><strong>la</strong>s</strong> áreas <strong>de</strong> <strong>la</strong> muestra 2 (f1) se muestran en <strong>la</strong> Col.[6]; éstas son proporcionales a (c’ i<br />
/p i<br />
).<br />
La probabilidad total <strong>de</strong> selección <strong>de</strong> un área <strong>de</strong> <strong>la</strong> muestra 2 es este valor multiplicado por <strong>la</strong><br />
probabilidad <strong>de</strong> selección <strong>de</strong>l área en <strong>la</strong> muestra 1 (f0 mostrado anteriormente en <strong>la</strong> tab<strong>la</strong> 1,<br />
Col.[6]), y es proporcional a c i<br />
, tal como se requiere.<br />
La tab<strong>la</strong> 3 ilustra el procedimiento <strong>para</strong> seleccionar <strong><strong>la</strong>s</strong> unida<strong>de</strong>s finales (niños y niñas<br />
trabajadores). Se supone que un promedio <strong>de</strong> b’ = 10 <strong>de</strong> dichos niños y niñas <strong>de</strong>be ser seleccionado<br />
por área <strong>de</strong> muestra, dando un tamaño total <strong>de</strong> muestra <strong>de</strong> n’ = a’ * b’ = 50 * 10 = 500 niños<br />
y niñas trabajadores. La Col.[6] i<strong>de</strong>ntifica <strong><strong>la</strong>s</strong> áreas que son «muy pequeñas», en el sentido <strong>de</strong><br />
que contienen menos <strong>de</strong> b’ = 10 <strong>de</strong> dichos niños y niñas. Hay muchas áreas <strong>de</strong> este tipo (45 <strong>de</strong><br />
cada 100) en <strong>la</strong> pob<strong>la</strong>ción ilustrativa. Esto no es poco realista, ya que los niños y <strong><strong>la</strong>s</strong> niñas trabajadores<br />
se encuentran a menudo concentrados <strong>de</strong> forma geográfica. Tratamos esta cuestión<br />
utilizando <strong>la</strong> opción (5) <strong>de</strong> <strong>la</strong> subsección 6.2.6, que se recomienda cuando se trata <strong>de</strong> muchas<br />
áreas muy pequeñas. Se excluye <strong>de</strong> <strong>la</strong> selección una mayoría <strong>de</strong> <strong><strong>la</strong>s</strong> áreas «muy pequeñas» (31<br />
<strong>de</strong> cada 45) y a <strong><strong>la</strong>s</strong> restantes (14) se les asigna <strong>la</strong> medida <strong>de</strong> tamaño mínima c’ i<br />
= b’ = 10. Todos<br />
los niños y <strong><strong>la</strong>s</strong> niñas trabajadores en estas áreas se llevan a <strong>la</strong> muestra (f2 = 1.0). La Col.[7] <strong>de</strong><br />
<strong>la</strong> tab<strong>la</strong> 3 presenta el índice <strong>de</strong> muestreo final <strong>de</strong>ntro <strong>de</strong> <strong><strong>la</strong>s</strong> áreas seleccionadas <strong>para</strong> <strong>la</strong> ENT.<br />
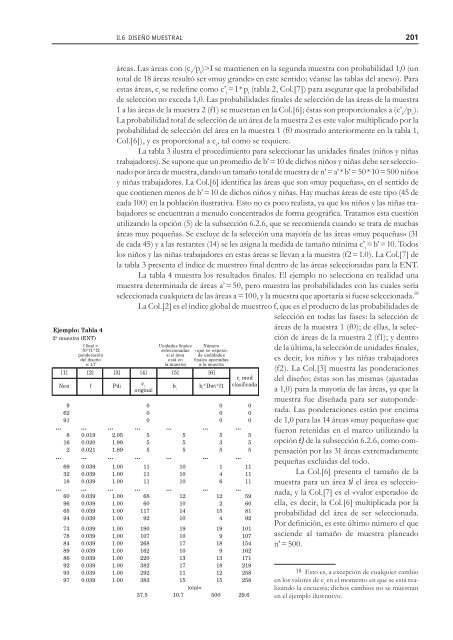
La tab<strong>la</strong> 4 muestra los resultados finales. El ejemplo no selecciona en realidad una<br />
muestra <strong>de</strong>terminada <strong>de</strong> áreas a’ = 50, pero muestra <strong><strong>la</strong>s</strong> probabilida<strong>de</strong>s con <strong><strong>la</strong>s</strong> cuales sería<br />
seleccionada cualquiera <strong>de</strong> <strong><strong>la</strong>s</strong> áreas a = 100, y <strong>la</strong> muestra que aportaría si fuese seleccionada. 18<br />
La Col.[2] es el índice global <strong>de</strong> muestreo f, que es el producto <strong>de</strong> <strong><strong>la</strong>s</strong> probabilida<strong>de</strong>s <strong>de</strong><br />
selección en todas <strong><strong>la</strong>s</strong> fases: <strong>la</strong> selección <strong>de</strong><br />
áreas <strong>de</strong> <strong>la</strong> muestra 1 (f0); <strong>de</strong> el<strong><strong>la</strong>s</strong>, <strong>la</strong> selección<br />
<strong>de</strong> áreas <strong>de</strong> <strong>la</strong> muestra 2 (f1); y <strong>de</strong>ntro<br />
…<br />
2.05<br />
1.99<br />
1.89<br />
…<br />
1.00<br />
1.00<br />
1.00<br />
…<br />
1.00<br />
1.00<br />
1.00<br />
1.00<br />
1.00<br />
1.00<br />
1.00<br />
1.00<br />
1.00<br />
1.00<br />
1.00<br />
1.00<br />
0<br />
0<br />
0<br />
…<br />
5<br />
5<br />
5<br />
…<br />
11<br />
11<br />
11<br />
…<br />
68<br />
60<br />
117<br />
92<br />
190<br />
107<br />
268<br />
162<br />
220<br />
382<br />
292<br />
383<br />
37.5<br />
Unida<strong>de</strong>s finales<br />
seleccionadas<br />
si el área<br />
está en<br />
<strong>la</strong> muestra<br />
…<br />
…<br />
…<br />
5<br />
5<br />
5<br />
10<br />
10<br />
10<br />
12<br />
10<br />
14<br />
10<br />
19<br />
10<br />
17<br />
10<br />
13<br />
17<br />
11<br />
15<br />
total=<br />
10.7<br />
Número<br />
«que se espera»<br />
<strong>de</strong> undida<strong>de</strong>s<br />
finales aportadas<br />
a <strong>la</strong> muestra<br />
[1] [2] [3] [4] [5] [6]<br />
Nen f Pdi<br />
c i<br />
original<br />
b i<br />
b i<br />
*Dwt*f1<br />
…<br />
…<br />
…<br />
0<br />
0<br />
0<br />
5<br />
3<br />
5<br />
1<br />
4<br />
6<br />
12<br />
2<br />
15<br />
4<br />
19<br />
9<br />
18<br />
9<br />
13<br />
18<br />
12<br />
15<br />
500<br />
c i<br />
mod<br />
c<strong><strong>la</strong>s</strong>ificada<br />
0<br />
0<br />
0<br />
…<br />
5<br />
5<br />
5<br />
…<br />
11<br />
11<br />
11<br />
…<br />
59<br />
60<br />
81<br />
92<br />
101<br />
107<br />
154<br />
162<br />
171<br />
219<br />
258<br />
258<br />
29.6<br />
<strong>de</strong> <strong>la</strong> última, <strong>la</strong> selección <strong>de</strong> unida<strong>de</strong>s finales,<br />
es <strong>de</strong>cir, los niños y <strong><strong>la</strong>s</strong> niñas trabajadores<br />
(f2). La Col.[3] muestra <strong><strong>la</strong>s</strong> pon<strong>de</strong>raciones<br />
<strong>de</strong>l diseño; éstas son <strong><strong>la</strong>s</strong> mismas (ajustadas<br />
a 1,0) <strong>para</strong> <strong>la</strong> mayoría <strong>de</strong> <strong><strong>la</strong>s</strong> áreas, ya que <strong>la</strong><br />
muestra fue diseñada <strong>para</strong> ser autopon<strong>de</strong>rada.<br />
Las pon<strong>de</strong>raciones están por encima<br />
<strong>de</strong> 1,0 <strong>para</strong> <strong><strong>la</strong>s</strong> 14 áreas «muy pequeñas» que<br />
fueron retenidas en el marco utilizando <strong>la</strong><br />
opción e) <strong>de</strong> <strong>la</strong> subsección 6.2.6, como compensación<br />
por <strong><strong>la</strong>s</strong> 31 áreas extremadamente<br />
pequeñas excluidas <strong>de</strong>l todo.<br />
La Col.[6] presenta el tamaño <strong>de</strong> <strong>la</strong><br />
muestra <strong>para</strong> un área si el área es seleccionada,<br />
y <strong>la</strong> Col.[7] es el «valor esperado» <strong>de</strong><br />
el<strong>la</strong>, es <strong>de</strong>cir, <strong>la</strong> Col.[6] multiplicada por <strong>la</strong><br />
probabilidad <strong>de</strong>l área <strong>de</strong> ser seleccionada.<br />
Por <strong>de</strong>finición, es este último número el que<br />
ascien<strong>de</strong> al tamaño <strong>de</strong> muestra p<strong>la</strong>neado<br />
n’ = 500.<br />
18 Esto es, a excepción <strong>de</strong> cualquier cambio<br />
en los valores <strong>de</strong> c i<br />
en el momento en que se está realizando<br />
<strong>la</strong> encuesta; dichos cambios no se muestran<br />
en el ejemplo ilustrativo.