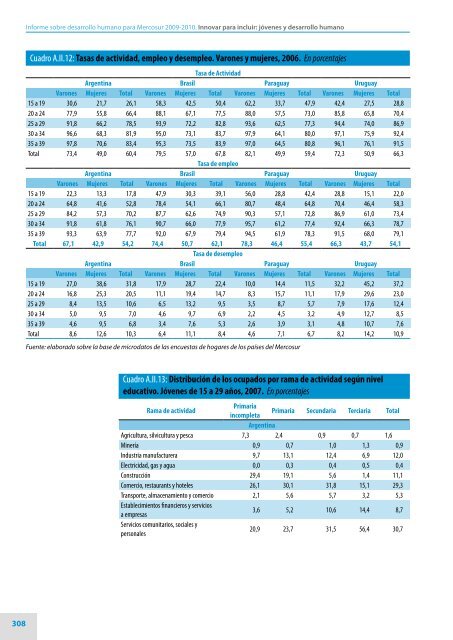
<strong>Informe</strong> <strong>sobre</strong> <strong>desarrollo</strong> <strong>humano</strong> <strong>para</strong> <strong>Mercosur</strong> <strong>2009</strong>-<strong>2010</strong>. Innovar <strong>para</strong> incluir: jóvenes y <strong>desarrollo</strong> <strong>humano</strong> Cuadro A.II.12: Tasas de actividad, empleo y desempleo. Varones y mujeres, 2006. En porcentajes Tasa de Actividad Argentina Brasil Paraguay Uruguay Varones Mujeres Total Varones Mujeres Total Varones Mujeres Total Varones Mujeres Total 15 a 19 30,6 21,7 26,1 58,3 42,5 50,4 62,2 33,7 47,9 42,4 27,5 28,8 20 a 24 77,9 55,8 66,4 88,1 67,1 77,5 88,0 57,5 73,0 85,8 65,8 70,4 25 a 29 91,8 66,2 78,5 93,9 72,2 82,8 93,6 62,5 77,3 94,4 74,0 86,9 30 a 34 96,6 68,3 81,9 95,0 73,1 83,7 97,9 64,1 80,0 97,1 75,9 92,4 35 a 39 97,8 70,6 83,4 95,3 73,5 83,9 97,0 64,5 80,8 96,1 76,1 91,5 Total 73,4 49,0 60,4 79,5 57,0 67,8 82,1 49,9 59,4 72,3 50,9 66,3 Tasa de empleo Argentina Brasil Paraguay Uruguay Varones Mujeres Total Varones Mujeres Total Varones Mujeres Total Varones Mujeres Total 15 a 19 22,3 13,3 17,8 47,9 30,3 39,1 56,0 28,8 42,4 28,8 15,1 22,0 20 a 24 64,8 41,6 52,8 78,4 54,1 66,1 80,7 48,4 64,8 70,4 46,4 58,3 25 a 29 84,2 57,3 70,2 87,7 62,6 74,9 90,3 57,1 72,8 86,9 61,0 73,4 30 a 34 91,8 61,8 76,1 90,7 66,0 77,9 95,7 61,2 77,4 92,4 66,3 78,7 35 a 39 93,3 63,9 77,7 92,0 67,9 79,4 94,5 61,9 78,3 91,5 68,0 79,1 Total 67,1 42,9 54,2 74,4 50,7 62,1 78,3 46,4 55,4 66,3 43,7 54,1 Tasa de desempleo Argentina Brasil Paraguay Uruguay Varones Mujeres Total Varones Mujeres Total Varones Mujeres Total Varones Mujeres Total 15 a 19 27,0 38,6 31,8 17,9 28,7 22,4 10,0 14,4 11,5 32,2 45,2 37,2 20 a 24 16,8 25,3 20,5 11,1 19,4 14,7 8,3 15,7 11,1 17,9 29,6 23,0 25 a 29 8,4 13,5 10,6 6,5 13,2 9,5 3,5 8,7 5,7 7,9 17,6 12,4 30 a 34 5,0 9,5 7,0 4,6 9,7 6,9 2,2 4,5 3,2 4,9 12,7 8,5 35 a 39 4,6 9,5 6,8 3,4 7,6 5,3 2,6 3,9 3,1 4,8 10,7 7,6 Total 8,6 12,6 10,3 6,4 11,1 8,4 4,6 7,1 6,7 8,2 14,2 10,9 Fuente: elaborado <strong>sobre</strong> la base de microdatos de las encuestas de hogares de los países del <strong>Mercosur</strong> Cuadro A.II.13: Distribución de los ocupados por rama de actividad según nivel educativo. Jóvenes de 15 a 29 años, 2007. En porcentajes Rama de actividad Primaria incompleta Primaria Secundaria Terciaria Total Argentina Agricultura, silvicultura y pesca 7,3 2,4 0,9 0,7 1,6 Minería 0,9 0,7 1,0 1,3 0,9 Industria manufacturera 9,7 13,1 12,4 6,9 12,0 Electricidad, gas y agua 0,0 0,3 0,4 0,5 0,4 Construcción 29,4 19,1 5,6 1,4 11,1 Comercio, restaurants y hoteles 26,1 30,1 31,8 15,1 29,3 Transporte, almacenamiento y comercio 2,1 5,6 5,7 3,2 5,3 Establecimientos financieros y servicios a empresas 3,6 5,2 10,6 14,4 8,7 Servicios comunitarios, sociales y personales 20,9 23,7 31,5 56,4 30,7 308
Anexo Metodológico Cuadro A.II.13: Distribución de los ocupados por rama de actividad según nivel educativo. Jóvenes de 15 a 29 años, 2007. En porcentajes (cont.) Brasil Agricultura, silvicultura y pesca 39,0 16,2 3,8 0,7 14,6 Minería 0,4 0,3 0,4 0,2 0,4 Industria manufacturera 12,2 17,2 16,8 9,4 15,6 Electricidad, gas y agua 0,1 0,2 0,5 0,5 0,3 Construcción 11,0 8,1 2,9 1,2 6,1 Comercio, restaurants y hoteles 17,3 28,7 31,5 14,4 26,8 Transporte, almacenamiento y comercio 3,5 4,2 5,3 3,5 4,5 Establecimientos financieros y servicios a empresas 2,2 5,4 12,1 20,5 8,4 Servicios comunitarios, sociales y personales 14,2 19,7 26,6 49,5 23,2 Paraguay Agricultura, silvicultura y pesca 55,9 39,8 8,1 2,3 30,3 Minería 0,7 0,5 0,1 0,0 0,4 Industria manufacturera 9,7 10,4 12,9 6,3 10,9 Electricidad, gas y agua 0,2 0,0 0,2 1,1 0,2 Construcción 5,7 5,2 3,2 0,0 4,4 Comercio, restaurants y hoteles 9,4 21,7 31,5 17,2 22,9 Transporte, almacenamiento y comercio 1,7 2,8 6,6 6,3 4,0 Establecimientos financieros y servicios a empresas 0,0 1,8 9,5 17,2 4,7 Servicios comunitarios, sociales y personales 16,7 17,7 28,0 49,4 22,3 Uruguay Agricultura, silvicultura y pesca 19,2 6,5 1,6 3,2 5,7 Minería 0,5 0,1 0,0 0,0 0,1 Industria manufacturera 11,5 18,7 10,1 7,2 16,0 Electricidad, gas y agua 0,2 0,3 0,2 0,3 0,3 Construcción 9,5 8,3 2,2 1,1 6,7 Comercio, restaurants y hoteles 30,9 32,5 27,0 9,3 29,8 Transporte, almacenamiento y comercio 5,2 5,1 7,6 3,7 5,6 Establecimientos financieros y servicios a empresas 7,2 5,6 16,9 30,8 9,6 Servicios comunitarios, sociales y personales 15,7 22,8 34,3 44,4 26,3 Fuente: elaborado <strong>sobre</strong> la base de microdatos de las encuestas de hogares de los países del <strong>Mercosur</strong> Cuadro A.II.14: Horas promedio semanales trabajadas por sexo, 2006 Argentina Brasil Uruguay Varones Mujeres Total Varones Mujeres Total Varones Mujeres Total 15 a 19 36,9 29,8 34,2 36,7 33,1 35,3 35,4 30,5 33,7 20 a 24 42,7 34,7 39,5 43,5 37,8 41,1 43,6 35,7 40,4 25 a 29 47,1 35,7 42,3 45,0 37,7 41,9 46,2 37,4 42,4 30 a 34 49,3 35,7 43,6 46,3 37,6 42,4 47,5 37,9 43,2 35 a 39 48,6 33,2 41,9 46,4 37,3 42,3 48,9 37,6 43,8 Total 47,3 35,1 42,1 43,7 35,7 40,6 46,0 36,9 42,1 Fuente: elaborado <strong>sobre</strong> la base de microdatos de las encuestas de hogares de los países del <strong>Mercosur</strong> 309
- Page 1 and 2:
Informe sobre desarrollo humano par
- Page 3 and 4:
Informe sobre desarrollo humano par
- Page 5 and 6:
Prólogo Rebeca Grynspan Administra
- Page 7 and 8:
Agradecimientos La Dirección para
- Page 9 and 10:
Índice Prólogo...................
- Page 11 and 12:
Capítulo 5 Juventud y espacio púb
- Page 13 and 14:
Social Mundial: una experiencia pol
- Page 15 and 16:
Cuadro 4.14: Mujeres por nivel de a
- Page 17:
Esquema 4.1: Círculo virtuoso de p
- Page 21 and 22:
Sinopsis S1. Planteamientos inicial
- Page 23 and 24:
Sinopsis (puesto 50) se ubican en e
- Page 25 and 26:
Sinopsis • El abandono temprano d
- Page 27 and 28:
Sinopsis subjetividad, ya que el tr
- Page 29 and 30:
Sinopsis en términos de capacitaci
- Page 31 and 32:
Sinopsis existe en la opinión púb
- Page 33 and 34:
Sinopsis juvenil. Son los propios j
- Page 35 and 36:
Sinopsis sectores en situación de
- Page 37 and 38:
Sinopsis S2.4.2. Políticas de subj
- Page 39 and 40:
Sinopsis de ciudadanía debería pa
- Page 41:
Sinopsis alimentan de los hallazgos
- Page 45 and 46:
Perspectiva general. Los jóvenes c
- Page 47 and 48:
Capítulo 1 | Perspectiva general.
- Page 49 and 50:
Capítulo 1 | Perspectiva general.
- Page 51 and 52:
Capítulo 1 | Perspectiva general.
- Page 53 and 54:
Capítulo 1 | Perspectiva general.
- Page 55 and 56:
Capítulo 1 | Perspectiva general.
- Page 57:
Capítulo 1 | Perspectiva general.
- Page 61 and 62:
Logros, problemas y opciones del de
- Page 63 and 64:
Capítulo 2 | Logros, problemas y o
- Page 65 and 66:
Capítulo 2 | Logros, problemas y o
- Page 67 and 68:
Capítulo 2 | Logros, problemas y o
- Page 69 and 70:
Capítulo 2 | Logros, problemas y o
- Page 71 and 72:
Capítulo 2 | Logros, problemas y o
- Page 73 and 74:
Capítulo 2 | Logros, problemas y o
- Page 75 and 76:
Capítulo 2 | Logros, problemas y o
- Page 77 and 78:
Capítulo 2 | Logros, problemas y o
- Page 79 and 80:
Capítulo 2 | Logros, problemas y o
- Page 81 and 82:
Capítulo 2 | Logros, problemas y o
- Page 83 and 84:
Capítulo 2 | Logros, problemas y o
- Page 85 and 86:
Capítulo 2 | Logros, problemas y o
- Page 87 and 88:
Capítulo 2 | Logros, problemas y o
- Page 89 and 90:
Capítulo 2 | Logros, problemas y o
- Page 91 and 92:
Capítulo 2 | Logros, problemas y o
- Page 93 and 94:
Capítulo 2 | Logros, problemas y o
- Page 95 and 96:
Capítulo 2 | Logros, problemas y o
- Page 97 and 98:
Capítulo 2 | Logros, problemas y o
- Page 99 and 100:
Capítulo 2 | Logros, problemas y o
- Page 101 and 102:
Capítulo 2 | Logros, problemas y o
- Page 103 and 104:
Capítulo 2 | Logros, problemas y o
- Page 105 and 106:
Capítulo 2 | Logros, problemas y o
- Page 107 and 108:
Capítulo 2 | Logros, problemas y o
- Page 109 and 110:
Capítulo 2 | Logros, problemas y o
- Page 111 and 112:
Capítulo 2 | Logros, problemas y o
- Page 113 and 114:
Capítulo 2 | Logros, problemas y o
- Page 115 and 116:
Capítulo 2 | Logros, problemas y o
- Page 117:
Capítulo 3 Hacia la búsqueda de u
- Page 120 and 121:
Informe sobre desarrollo humano par
- Page 122 and 123:
Informe sobre desarrollo humano par
- Page 124 and 125:
Informe sobre desarrollo humano par
- Page 126 and 127:
Informe sobre desarrollo humano par
- Page 128 and 129:
Informe sobre desarrollo humano par
- Page 130 and 131:
Informe sobre desarrollo humano par
- Page 132 and 133:
Informe sobre desarrollo humano par
- Page 134 and 135:
Informe sobre desarrollo humano par
- Page 136 and 137:
Informe sobre desarrollo humano par
- Page 138 and 139:
Informe sobre desarrollo humano par
- Page 140 and 141:
Informe sobre desarrollo humano par
- Page 142 and 143:
Informe sobre desarrollo humano par
- Page 144 and 145:
Informe sobre desarrollo humano par
- Page 146 and 147:
Informe sobre desarrollo humano par
- Page 148 and 149:
Informe sobre desarrollo humano par
- Page 150 and 151:
Informe sobre desarrollo humano par
- Page 152 and 153:
Informe sobre desarrollo humano par
- Page 154 and 155:
Informe sobre desarrollo humano par
- Page 156 and 157:
Informe sobre desarrollo humano par
- Page 158 and 159:
Informe sobre desarrollo humano par
- Page 161 and 162:
Lo popular y la estética de la mod
- Page 163 and 164:
Apartado 1 | Lo popular y la estét
- Page 165 and 166:
Apartado 1 | Lo popular y la estét
- Page 167:
Capítulo 4 Agencia y exclusión en
- Page 170 and 171:
Informe sobre desarrollo humano par
- Page 172 and 173:
Informe sobre desarrollo humano par
- Page 174 and 175:
Informe sobre desarrollo humano par
- Page 176 and 177:
Informe sobre desarrollo humano par
- Page 178 and 179:
Informe sobre desarrollo humano par
- Page 180 and 181:
Informe sobre desarrollo humano par
- Page 182 and 183:
Informe sobre desarrollo humano par
- Page 184 and 185:
Informe sobre desarrollo humano par
- Page 186 and 187:
Informe sobre desarrollo humano par
- Page 188 and 189:
Informe sobre desarrollo humano par
- Page 190 and 191:
Informe sobre desarrollo humano par
- Page 192 and 193:
Informe sobre desarrollo humano par
- Page 194 and 195:
Informe sobre desarrollo humano par
- Page 196 and 197:
Informe sobre desarrollo humano par
- Page 198 and 199:
Informe sobre desarrollo humano par
- Page 200 and 201:
Informe sobre desarrollo humano par
- Page 202 and 203:
Informe sobre desarrollo humano par
- Page 204 and 205:
Informe sobre desarrollo humano par
- Page 206 and 207:
Informe sobre desarrollo humano par
- Page 208 and 209:
Informe sobre desarrollo humano par
- Page 210 and 211:
Informe sobre desarrollo humano par
- Page 213:
Apartado 2 Juventudes rurales del M
- Page 216 and 217:
Informe sobre desarrollo humano par
- Page 218 and 219:
Informe sobre desarrollo humano par
- Page 220 and 221:
Informe sobre desarrollo humano par
- Page 222 and 223:
Informe sobre desarrollo humano par
- Page 225 and 226:
Juventud y espacio público: movili
- Page 227 and 228:
Capítulo 5 | Juventud y espacio p
- Page 229 and 230:
Capítulo 5 | Juventud y espacio p
- Page 231 and 232:
Capítulo 5 | Juventud y espacio p
- Page 233 and 234:
Capítulo 5 | Juventud y espacio p
- Page 235 and 236:
Capítulo 5 | Juventud y espacio p
- Page 237 and 238:
Capítulo 5 | Juventud y espacio p
- Page 239 and 240:
Capítulo 5 | Juventud y espacio p
- Page 241 and 242:
Capítulo 5 | Juventud y espacio p
- Page 243 and 244:
Capítulo 5 | Juventud y espacio p
- Page 245 and 246:
Capítulo 5 | Juventud y espacio p
- Page 247 and 248:
Capítulo 5 | Juventud y espacio p
- Page 249 and 250:
Capítulo 5 | Juventud y espacio p
- Page 251:
Capítulo 5 | Juventud y espacio p
- Page 255 and 256:
Por qué las jóvenes son estratég
- Page 257 and 258: Apartado 3 | Por qué las jóvenes
- Page 259 and 260: Apartado 3 | Por qué las jóvenes
- Page 261: Apartado 3 | Por qué las jóvenes
- Page 265 and 266: Juventud y políticas en el espacio
- Page 267 and 268: Capítulo 6 | Juventud y políticas
- Page 269 and 270: Capítulo 6 | Juventud y políticas
- Page 271 and 272: Capítulo 6 | Juventud y políticas
- Page 273 and 274: Capítulo 6 | Juventud y políticas
- Page 275 and 276: Capítulo 6 | Juventud y políticas
- Page 277 and 278: Capítulo 6 | Juventud y políticas
- Page 279 and 280: Capítulo 6 | Juventud y políticas
- Page 281 and 282: Capítulo 6 | Juventud y políticas
- Page 283 and 284: Capítulo 6 | Juventud y políticas
- Page 285 and 286: Capítulo 6 | Juventud y políticas
- Page 287 and 288: Capítulo 6 | Juventud y políticas
- Page 289 and 290: Capítulo 6 | Juventud y políticas
- Page 291 and 292: Capítulo 6 | Juventud y políticas
- Page 293: Anexo Metodológico
- Page 296 and 297: Informe sobre desarrollo humano par
- Page 298 and 299: Informe sobre desarrollo humano par
- Page 300 and 301: Informe sobre desarrollo humano par
- Page 302 and 303: Informe sobre desarrollo humano par
- Page 304 and 305: Informe sobre desarrollo humano par
- Page 306 and 307: Informe sobre desarrollo humano par
- Page 310 and 311: Informe sobre desarrollo humano par
- Page 312 and 313: Informe sobre desarrollo humano par
- Page 314 and 315: Informe sobre desarrollo humano par
- Page 316 and 317: Informe sobre desarrollo humano par
- Page 318 and 319: Informe sobre desarrollo humano par
- Page 320 and 321: Informe sobre desarrollo humano par
- Page 322 and 323: Informe sobre desarrollo humano par
- Page 324 and 325: Informe sobre desarrollo humano par
- Page 326 and 327: Informe sobre desarrollo humano par
- Page 328 and 329: Informe sobre desarrollo humano par
- Page 330 and 331: Informe sobre desarrollo humano par
- Page 332 and 333: Informe sobre desarrollo humano par
- Page 334 and 335: Informe sobre desarrollo humano par
- Page 336 and 337: Informe sobre desarrollo humano par
- Page 338 and 339: Informe sobre desarrollo humano par
- Page 340 and 341: Informe sobre desarrollo humano par
- Page 342 and 343: Informe sobre desarrollo humano par
- Page 344 and 345: Informe sobre desarrollo humano par
- Page 346 and 347: Informe sobre desarrollo humano par
- Page 348 and 349: Informe sobre desarrollo humano par
- Page 350 and 351: Informe sobre desarrollo humano par
- Page 352 and 353: Informe sobre desarrollo humano par
- Page 354 and 355: Informe sobre desarrollo humano par
- Page 356 and 357: Informe sobre desarrollo humano par
- Page 358 and 359:
Informe sobre desarrollo humano par
- Page 360 and 361:
Informe sobre desarrollo humano par
- Page 362 and 363:
Informe sobre desarrollo humano par
- Page 364 and 365:
Informe sobre desarrollo humano par
- Page 366 and 367:
Informe sobre desarrollo humano par
- Page 368 and 369:
Informe sobre desarrollo humano par
- Page 371 and 372:
Bibliografía Abad, M. (2002). “L
- Page 373 and 374:
Bibliografía Calderón, F y Jelin,
- Page 375 and 376:
Bibliografía of public information
- Page 377 and 378:
Bibliografía Kessler, G. (2006),
- Page 379 and 380:
Bibliografía Paes de Barros R.; Ca
- Page 381:
Bibliografía Tirelli, J. (2004),