ANEXO ESTADÍSTICO / 363Cuadro 10PORCENTAJE DE MUJERES POR SECTOR DE ESTUDIOSEducaciónLetrasy artesCienciassociales,empresarialesy jurídicasCienciasIngeniería,industria yconstrucciónAgriculturaSalud ybienestarsocialServiciosSector<strong>de</strong>sconocidoo noespecificadoPaís o territorio78,5** 65,7** 44,1** 48,4** 26,1** 38,1** 49,4** 34,5** 52,1**... ... ... ... ... ... ... ... 51,865,9 79,5 39,5 66,8 28,2 29,2 74,8 8,0 21,7... ... ... ... ... ... ... ... 55,879,1 67,0 44,2 56,4 43,2 13,2 57,3 19,9 –77,1 70,4 64,1 49,9 49,3 63,8 84,2 29,7 69,4... ... ... ... ... ... ... ... ...... ... ... ... ... ... ... ... ...... ... ... ... ... ... ... ... ...... ... ... ... ... ... ... ... ...36,1 40,5 31,4 30,8 10,6 17,5 18,5 26,3 16,1... ... ... ... ... ... ... ... 33,8**43,5 – 42,3 39,1 24,9 – 40,6 – 35,2. . . . . . . . .... ... ... ... ... ... ... ... 20,6... ... ... ... ... ... ... ... ...56,9, z 66,2, z 51,3, z 52,6, z 16,3, z 43,3, z 60,4, z 24,8, z 72,7, z... ... ... ... ... ... ... ... ...75,3 65,6 55,1 38,3 18,6 44,4 75,5 60,1 52,966,9 55,1 60,0 47,8 40,8 . 72,9 . 61,030,7 32,3 32,3 16,5 4,1 14,0 30,1 40,8 22,2... ... ... ... ... ... ... ... ...... ... ... ... ... ... ... ... ...... ... ... ... ... ... ... ... ...... ... ... ... ... ... ... ... 55,6... ... ... ... ... ... ... ... 45,9... ... ... ... ... ... ... ... ...... ... ... ... ... ... ... ... 56,5. . . . . . . . .70,6 67,6 32,6 24,7 11,6 40,0 65,1 80,2 50,0... ... ... ... ... ... ... ... ...... ... ... ... ... ... ... ... ...... ... ... ... ... ... ... ... 54,3... ... ... ... ... ... ... ... .... . . . . . . . .. . . . . . . . .80,3 64,0 57,2 40,9 26,6 41,5 80,5 51,3 52,3... ... ... ... ... ... ... ... 63,4**... ... ... ... ... ... ... ... ...67,7 56,6 35,4 33,7 17,5 27,9 61,2 34,6 .42,4 39,7 42,4 39,4 10,2 21,0 53,2 21,6 38,9... ... ... ... ... ... ... ... ...66,7, z 57,3, z 37,3, z 41,4, z 3,5, z 28,6, z 80,6, z 11,8, z 44,1, z... ... ... ... ... ... ... ... ...... ... ... ... ... ... ... ... 52,1... ... ... ... ... ... ... ... 52,9*. . . . . . . . .... ... ... ... ... ... ... ... 57,9**. . . . . . . . .... ... ... ... ... ... ... ... ...55,6 68,8 48,6 – 14,4 34,0 40,1 – 43,4... ... ... ... ... ... ... ... ...81,7, y 42,3, y 32,4, y 40,5, y 0,6, y 28,4, y 39,6, y . 25,0, yAsia CentralArmeniaAzerbaiyánGeorgiaKazajstánKirguistánMongoliaTayikistánTurkmenistánUzbekistánAsia Meridional y Occi<strong>de</strong>ntalAfganistánBang<strong>la</strong><strong>de</strong>shBhutánIndia wMaldivasNepalPakistánRepública Islámica d<strong>el</strong> IránSri Lanka wAsia Oriental y <strong>el</strong> PacíficoAustralia oBrunei Darussa<strong>la</strong>mCamboyaChina wEstados Fe<strong>de</strong>rados <strong>de</strong> MicronesiaFijiFilipinas wIndonesia wIs<strong>la</strong>s CookIs<strong>la</strong>s MarshallIs<strong>la</strong>s SalomónJapón oKiribatiMacao, ChinaMa<strong>la</strong>sia wMyanmarNauruNiueNueva Z<strong>el</strong>andia oPa<strong>la</strong>uPapua Nueva GuineaRepública <strong>de</strong> Corea oRepública Democrática Popu<strong>la</strong>r LaoRep. Popu<strong>la</strong>r Democrática <strong>de</strong> CoreaSamoaSingapurTai<strong>la</strong>ndia wTimor-LesteTok<strong>el</strong>auTongaTuvaluVanuatuViet NamEstados ÁrabesArg<strong>el</strong>iaArabia Saudita
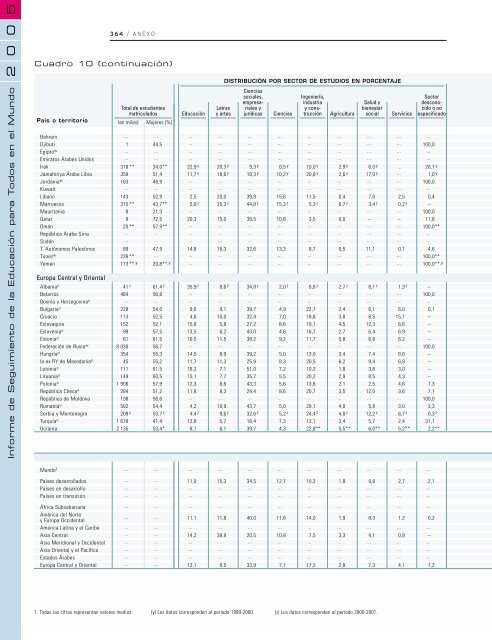
50364 / ANEXO02<strong>Informe</strong> <strong>de</strong> Seguimiento <strong>de</strong> <strong>la</strong> Educación <strong>para</strong> Todos en <strong>el</strong> MundoCuadro 10 (continuación)País o territorioBahreinDjibutiEgipto wEmiratos Árabes UnidosIrakJamahiriya Árabe LibiaJordania wKuwaitLíbanoMarruecosMauritaniaQatarOmánRepública Árabe SiriaSudánT. Autónomos PalestinosTúnez wYemenEuropa Central y OrientalAlbania oB<strong>el</strong>arrúsBosnia y Herzegovina oBulgaria oCroaciaEslovaquiaEslovenia oEstonia oFe<strong>de</strong>ración <strong>de</strong> Rusia wHungría o<strong>la</strong> ex RY <strong>de</strong> Macedonia oLetonia oLituania oPolonia oRepública Checa oRepública <strong>de</strong> MoldovaRumania oSerbia y MontenegroTurquía oUcraniaTotal <strong>de</strong> estudiantesmatricu<strong>la</strong>dos(en miles) Mujeres (%)EducaciónLetrasy artesDISTRIBUCIÓN POR SECTOR DE ESTUDIOS EN PORCENTAJECienciassociales,empresarialesyjurídicasCienciasIngeniería,industriay construcciónAgriculturaSalud ybienestarsocialServiciosSector<strong>de</strong>sconocidoo noespecificado... ... ... ... ... ... ... ... ... ... ...1 44,5 ... ... ... ... ... ... ... ... 100,0... ... ... ... ... ... ... ... ... ... ...... ... ... ... ... ... ... ... ... ... ...318,** 34,0** 22,9, y 20,3, y 9,3, y 0,5, y 10,0, y 2,9, y 6,0, y . 28,1, y359 51,4 11,7, y 18,6, y 18,3, y 10,2, y 20,6, y 2,6, y 17,0, y ... 1,0, y163 48,9 ... ... ... ... ... ... ... ... 100,0... ... ... ... ... ... ... ... ... ... ...143 52,9 2,5 20,0 39,8 15,8 11,5 0,4 7,0 2,5 0,4315,** 43,7** 5,0, z 25,3, z 44,8, z 15,3, z 5,3, z 0,7, z 3,4, z 0,2, z –8 21,3 ... ... ... ... ... ... ... ... 100,08 72,5 20,3 15,0 38,5 10,8 3,5 0,0 – – 11,820,** 57,9** ... ... ... ... ... ... ... ... 100,0**... ... ... ... ... ... ... ... ... ... ...... ... ... ... ... ... ... ... ... ... ...89 47,9 14,8 16,3 32,6 13,3 6,7 0,5 11,1 0,1 4,6226,** ... ... ... ... ... ... ... ... ... 100,0**173,** ,y 20,8** ,y ... ... ... ... ... ... ... ... 100,0** ,y41, z 61,4, z 35,9, z 8,6, z 34,8, z 2,0, z 6,6, z 2,7, z 8,1, z 1,3, z –464 56,8 ... ... ... ... ... ... ... ... 100,0... ... ... ... ... ... ... ... ... ... ...228 54,0 9,0 9,1 39,7 4,9 22,7 2,4 6,1 6,0 0,1113 52,5 4,6 10,0 32,4 7,0 18,6 3,8 8,5 15,1 –152 52,1 15,8 5,8 27,2 8,6 19,1 4,5 12,3 6,6 –99 57,5 13,5 6,2 43,0 4,6 16,7 2,7 6,4 6,9 –61 61,5 10,5 11,5 38,2 9,2 11,7 5,8 6,8 6,2 –8 030 56,7 ... ... ... ... ... ... ... ... 100,0354 55,3 14,5 8,9 39,2 5,0 13,0 3,4 7,4 8,6 –45 55,2 11,7 11,3 25,9 8,3 20,5 6,2 9,4 6,8 –111 61,5 16,2 7,1 51,0 7,2 10,2 1,8 3,6 3,0 –149 60,5 15,1 7,7 35,7 5,5 20,2 2,9 8,5 4,3 –1 906 57,9 12,3 8,6 43,3 5,6 13,6 2,1 2,5 4,6 7,3284 51,2 11,8 8,3 24,4 8,6 20,7 3,5 12,0 3,6 7,1108 56,6 ... ... ... ... ... ... ... ... 100,0582 54,4 4,2 10,9 43,7 5,0 20,1 4,0 5,8 3,0 3,3209, z 53,7, z 4,4, z 9,6, z 32,6, z 5,2, z 24,4, z 4,8, z 12,2, z 6,7, z 0,3, z1 678 41,4 12,8 5,7 18,4 7,3 13,1 3,4 5,7 2,4 31,12 135 53,4* 8,1 6,1 39,7 4,3 22,8** 5,5** 6,0** 5,2** 2,2**Mundo 1Países <strong>de</strong>sarrol<strong>la</strong>dosPaíses en <strong>de</strong>sarrolloPaíses en transiciónÁfrica SubsaharianaAmérica d<strong>el</strong> Nortey Europa Occi<strong>de</strong>ntalAmérica Latina y <strong>el</strong> CaribeAsia CentralAsia Meridional y Occi<strong>de</strong>ntalAsia Oriental y <strong>el</strong> PacíficoEstados ÁrabesEuropa Central y Oriental... ... ... ... ... ... ... ... ... ... ...... ... 11,0 15,3 34,5 12,7 10,3 1,8 9,8 2,7 2,1... ... ... ... ... ... ... ... ... ... ...... ... ... ... ... ... ... ... ... ... ...... ... ... ... ... ... ... ... ... ... ...... ... 11,1 11,8 40,0 11,6 14,0 1,9 8,3 1,2 0,2... ... ... ... ... ... ... ... ... ... ...... ... 14,2 38,9 20,5 10,8 7,5 3,3 4,1 0,8 –... ... ... ... ... ... ... ... ... ... ...... ... ... ... ... ... ... ... ... ... ...... ... ... ... ... ... ... ... ... ... ...... ... 12,1 8,5 33,9 7,1 17,2 2,8 7,3 4,1 7,21. Todas <strong>la</strong>s cifras representan valores medios.(y) Los datos correspon<strong>de</strong>n al periodo 1999-2000. (z) Los datos correspon<strong>de</strong>n al periodo 2000-2001.
- Page 1 and 2:
Informe de Seguimientode la EPT en
- Page 3 and 4:
Educación para TodosEL IMPERATIVOD
- Page 5 and 6:
PrefacioTratar de lograr la Educaci
- Page 7 and 8:
AgradecimientosEl equipo que prepar
- Page 9 and 10:
ÍndiceMensajes principales . . . .
- Page 13 and 14:
2.6: Distribución porcentual del e
- Page 15 and 16:
3.10: Relación entre las competenc
- Page 17 and 18:
Informe de Seguimiento de la Educac
- Page 19 and 20:
calidad para todosUn mejor aprendiz
- Page 21 and 22:
Informe de Seguimiento de la Educac
- Page 23 and 24:
RESUMEN DEL INFORME / 23Por último
- Page 25 and 26:
RESUMEN DEL INFORME / 25debido tiem
- Page 27 and 28:
RESUMEN DEL INFORME / 27Datos exact
- Page 29 and 30:
Informe de Seguimiento de la Educac
- Page 31 and 32:
ENTENDER QUÉ ES LA CALIDAD DE LA E
- Page 33 and 34:
ENTENDER QUÉ ES LA CALIDAD DE LA E
- Page 35 and 36:
ENTENDER QUÉ ES LA CALIDAD DE LA E
- Page 37 and 38:
ENTENDER QUÉ ES LA CALIDAD DE LA E
- Page 39 and 40:
ENTENDER QUÉ ES LA CALIDAD DE LA E
- Page 41 and 42:
ENTENDER QUÉ ES LA CALIDAD DE LA E
- Page 43 and 44:
Informe de Seguimiento de la Educac
- Page 45 and 46:
LA IMPORTANCIA DE LA CALIDAD: ENSE
- Page 47 and 48:
LA IMPORTANCIA DE LA CALIDAD: ENSE
- Page 49 and 50:
LA IMPORTANCIA DE LA CALIDAD: ENSE
- Page 51 and 52:
LA IMPORTANCIA DE LA CALIDAD: ENSE
- Page 53 and 54:
LA IMPORTANCIA DE LA CALIDAD: ENSE
- Page 55 and 56:
LA IMPORTANCIA DE LA CALIDAD: ENSE
- Page 57 and 58:
LA IMPORTANCIA DE LA CALIDAD: ENSE
- Page 59 and 60:
LA IMPORTANCIA DE LA CALIDAD: ENSE
- Page 61 and 62:
LA IMPORTANCIA DE LA CALIDAD: ENSE
- Page 63 and 64:
LA IMPORTANCIA DE LA CALIDAD: ENSE
- Page 65 and 66:
LA IMPORTANCIA DE LA CALIDAD: ENSE
- Page 67 and 68:
LA IMPORTANCIA DE LA CALIDAD: ENSE
- Page 69 and 70:
LA IMPORTANCIA DE LA CALIDAD: ENSE
- Page 71 and 72:
LA IMPORTANCIA DE LA CALIDAD: ENSE
- Page 73 and 74:
LA IMPORTANCIA DE LA CALIDAD: ENSE
- Page 75 and 76:
LA IMPORTANCIA DE LA CALIDAD: ENSE
- Page 77 and 78:
LA IMPORTANCIA DE LA CALIDAD: ENSE
- Page 79 and 80:
LA IMPORTANCIA DE LA CALIDAD: ENSE
- Page 81 and 82:
LA IMPORTANCIA DE LA CALIDAD: ENSE
- Page 83 and 84:
LA IMPORTANCIA DE LA CALIDAD: ENSE
- Page 85 and 86:
LA IMPORTANCIA DE LA CALIDAD: ENSE
- Page 87 and 88:
LA IMPORTANCIA DE LA CALIDAD: ENSE
- Page 89 and 90:
LA IMPORTANCIA DE LA CALIDAD: ENSE
- Page 91 and 92:
Informe de Seguimiento de la Educac
- Page 93 and 94:
EVALUACIÓN DE LOS PROGRESOS HACIA
- Page 95 and 96:
EVALUACIÓN DE LOS PROGRESOS HACIA
- Page 97 and 98:
EVALUACIÓN DE LOS PROGRESOS HACIA
- Page 99 and 100:
EVALUACIÓN DE LOS PROGRESOS HACIA
- Page 101 and 102:
EVALUACIÓN DE LOS PROGRESOS HACIA
- Page 103 and 104:
EVALUACIÓN DE LOS PROGRESOS HACIA
- Page 105 and 106:
EVALUACIÓN DE LOS PROGRESOS HACIA
- Page 107 and 108:
EVALUACIÓN DE LOS PROGRESOS HACIA
- Page 109 and 110:
EVALUACIÓN DE LOS PROGRESOS HACIA
- Page 111 and 112:
EVALUACIÓN DE LOS PROGRESOS HACIA
- Page 113 and 114:
EVALUACIÓN DE LOS PROGRESOS HACIA
- Page 115 and 116:
EVALUACIÓN DE LOS PROGRESOS HACIA
- Page 117 and 118:
EVALUACIÓN DE LOS PROGRESOS HACIA
- Page 119 and 120:
EVALUACIÓN DE LOS PROGRESOS HACIA
- Page 121 and 122:
EVALUACIÓN DE LOS PROGRESOS HACIA
- Page 123 and 124:
EVALUACIÓN DE LOS PROGRESOS HACIA
- Page 125 and 126:
EVALUACIÓN DE LOS PROGRESOS HACIA
- Page 127 and 128:
EVALUACIÓN DE LOS PROGRESOS HACIA
- Page 129 and 130:
EVALUACIÓN DE LOS PROGRESOS HACIA
- Page 131 and 132:
EVALUACIÓN DE LOS PROGRESOS HACIA
- Page 133 and 134:
EVALUACIÓN DE LOS PROGRESOS HACIA
- Page 135 and 136:
EVALUACIÓN DE LOS PROGRESOS HACIA
- Page 137 and 138:
EVALUACIÓN DE LOS PROGRESOS HACIA
- Page 139 and 140:
EVALUACIÓN DE LOS PROGRESOS HACIA
- Page 141 and 142:
EVALUACIÓN DE LOS PROGRESOS HACIA
- Page 143 and 144:
EVALUACIÓN DE LOS PROGRESOS HACIA
- Page 145 and 146:
EVALUACIÓN DE LOS PROGRESOS HACIA
- Page 147 and 148:
EVALUACIÓN DE LOS PROGRESOS HACIA
- Page 149 and 150:
EVALUACIÓN DE LOS PROGRESOS HACIA
- Page 151 and 152:
EVALUACIÓN DE LOS PROGRESOS HACIA
- Page 153 and 154:
EVALUACIÓN DE LOS PROGRESOS HACIA
- Page 155 and 156:
EVALUACIÓN DE LOS PROGRESOS HACIA
- Page 157 and 158:
EVALUACIÓN DE LOS PROGRESOS HACIA
- Page 159 and 160:
Informe de Seguimiento de la Educac
- Page 161 and 162:
POLÍTICAS PARA MEJORAR LA CALIDAD
- Page 163 and 164:
POLÍTICAS PARA MEJORAR LA CALIDAD
- Page 165 and 166:
POLÍTICAS PARA MEJORAR LA CALIDAD
- Page 167 and 168:
POLÍTICAS PARA MEJORAR LA CALIDAD
- Page 169 and 170:
POLÍTICAS PARA MEJORAR LA CALIDAD
- Page 171 and 172:
POLÍTICAS PARA MEJORAR LA CALIDAD
- Page 173 and 174:
POLÍTICAS PARA MEJORAR LA CALIDAD
- Page 175 and 176:
POLÍTICAS PARA MEJORAR LA CALIDAD
- Page 177 and 178:
POLÍTICAS PARA MEJORAR LA CALIDAD
- Page 179 and 180:
POLÍTICAS PARA MEJORAR LA CALIDAD
- Page 181 and 182:
POLÍTICAS PARA MEJORAR LA CALIDAD
- Page 183 and 184:
POLÍTICAS PARA MEJORAR LA CALIDAD
- Page 185 and 186:
POLÍTICAS PARA MEJORAR LA CALIDAD
- Page 187 and 188:
POLÍTICAS PARA MEJORAR LA CALIDAD
- Page 189 and 190:
POLÍTICAS PARA MEJORAR LA CALIDAD
- Page 191 and 192:
POLÍTICAS PARA MEJORAR LA CALIDAD
- Page 193 and 194:
POLÍTICAS PARA MEJORAR LA CALIDAD
- Page 195 and 196:
POLÍTICAS PARA MEJORAR LA CALIDAD
- Page 197 and 198:
POLÍTICAS PARA MEJORAR LA CALIDAD
- Page 199 and 200:
POLÍTICAS PARA MEJORAR LA CALIDAD
- Page 201 and 202:
POLÍTICAS PARA MEJORAR LA CALIDAD
- Page 203 and 204:
POLÍTICAS PARA MEJORAR LA CALIDAD
- Page 205 and 206:
POLÍTICAS PARA MEJORAR LA CALIDAD
- Page 207 and 208:
POLÍTICAS PARA MEJORAR LA CALIDAD
- Page 209 and 210:
Informe de Seguimiento de la Educac
- Page 211 and 212:
CUMPLIR NUESTROS COMPROMISOS INTERN
- Page 213 and 214:
CUMPLIR NUESTROS COMPROMISOS INTERN
- Page 215 and 216:
CUMPLIR NUESTROS COMPROMISOS INTERN
- Page 217 and 218:
CUMPLIR NUESTROS COMPROMISOS INTERN
- Page 219 and 220:
CUMPLIR NUESTROS COMPROMISOS INTERN
- Page 221 and 222:
CUMPLIR NUESTROS COMPROMISOS INTERN
- Page 223 and 224:
CUMPLIR NUESTROS COMPROMISOS INTERN
- Page 225 and 226:
CUMPLIR NUESTROS COMPROMISOS INTERN
- Page 227 and 228:
CUMPLIR NUESTROS COMPROMISOS INTERN
- Page 229 and 230:
CUMPLIR NUESTROS COMPROMISOS INTERN
- Page 231 and 232:
CUMPLIR NUESTROS COMPROMISOS INTERN
- Page 233 and 234:
CUMPLIR NUESTROS COMPROMISOS INTERN
- Page 235 and 236:
CUMPLIR NUESTROS COMPROMISOS INTERN
- Page 237 and 238:
CUMPLIR NUESTROS COMPROMISOS INTERN
- Page 239 and 240:
CUMPLIR NUESTROS COMPROMISOS INTERN
- Page 241 and 242:
CUMPLIR NUESTROS COMPROMISOS INTERN
- Page 243 and 244:
CUMPLIR NUESTROS COMPROMISOS INTERN
- Page 245 and 246:
CUMPLIR NUESTROS COMPROMISOS INTERN
- Page 247 and 248:
CUMPLIR NUESTROS COMPROMISOS INTERN
- Page 249 and 250:
Informe de Seguimiento de la Educac
- Page 251 and 252:
HACIA LA EDUCACIÓN PARA TODOS: EL
- Page 253 and 254:
HACIA LA EDUCACIÓN PARA TODOS: EL
- Page 255 and 256:
HACIA LA EDUCACIÓN PARA TODOS: EL
- Page 257 and 258:
HACIA LA EDUCACIÓN PARA TODOS: EL
- Page 259 and 260:
HACIA LA EDUCACIÓN PARA TODOS: EL
- Page 261 and 262:
Informe de Seguimiento de la Educac
- Page 263 and 264:
005264 / ANEXO2Informe de Seguimien
- Page 265 and 266:
005266 / ANEXO2Informe de Seguimien
- Page 267 and 268:
050268 / ANEXO2Informe de Seguimien
- Page 269 and 270:
005270 / ANEXO2Informe de Seguimien
- Page 271 and 272:
005272 / ANEXO2Informe de Seguimien
- Page 273 and 274:
005274 / ANEXO2Cuadro A1: El Índic
- Page 275 and 276:
50276 / ANEXO02Cuadro A2: Clasifica
- Page 277 and 278:
2005278 / ANEXOInforme de Seguimien
- Page 279 and 280:
0025280 / ANEXOInforme de Seguimien
- Page 281 and 282:
0025282 / ANEXOInforme de Seguimien
- Page 283 and 284:
50284 / ANEXO02Años de referencia
- Page 285 and 286:
2 0 0Informe de Seguimiento de la E
- Page 287 and 288:
5002288 / ANEXOCuadro 1 (continuaci
- Page 289 and 290:
5002290 / ANEXOCuadro 1 (continuaci
- Page 291 and 292:
5002292 / ANEXOCuadro 1 (continuaci
- Page 293 and 294:
0502294 / ANEXOCuadro 2Alfabetizaci
- Page 295 and 296:
50296 / ANEXO02Informe de Seguimien
- Page 297 and 298:
50298 / ANEXO02Informe de Seguimien
- Page 299 and 300:
50300 / ANEXO02Informe de Seguimien
- Page 301 and 302:
5002302 / ANEXOCuadro 3Atención y
- Page 303 and 304:
50304 / ANEXO02Informe de Seguimien
- Page 305 and 306:
005306 / ANEXO2Informe de Seguimien
- Page 307 and 308:
52 0 0Informe de Seguimiento de la
- Page 309 and 310:
5002310 / ANEXOCuadro 4Acceso a la
- Page 311 and 312: 50312 / ANEXO02Informe de Seguimien
- Page 313 and 314: 05314 / ANEXO02Informe de Seguimien
- Page 315 and 316: 50316 / ANEXO02Informe de Seguimien
- Page 317 and 318: 0025318 / ANEXOCuadro 5Participaci
- Page 319 and 320: 50320 / ANEXO02Informe de Seguimien
- Page 321 and 322: 50322 / ANEXO02Informe de Seguimien
- Page 323 and 324: 50324 / ANEXO02Informe de Seguimien
- Page 325 and 326: 5002326 / ANEXOCuadro 6Eficacia int
- Page 327 and 328: 0025328 / ANEXOCuadro 6 (continuaci
- Page 329 and 330: 5002330 / ANEXOCuadro 6 (continuaci
- Page 331 and 332: 5002332 / ANEXOCuadro 6 (continuaci
- Page 333 and 334: 0334 / ANEXO025Cuadro 7. Eficacia i
- Page 335 and 336: 50336 / ANEXO02Cuadro 7 (continuaci
- Page 337 and 338: 05338 / ANEXO02Cuadro 7 (continuaci
- Page 339 and 340: 50340 / ANEXO02Cuadro 7 (continuaci
- Page 341 and 342: 050342 / ANEXO2Cuadro 8. Participac
- Page 343 and 344: 2 0 0Informe de Seguimiento de la E
- Page 345 and 346: 2 0 0Informe de Seguimiento de la E
- Page 347 and 348: 52 0 0Informe de Seguimiento de la
- Page 349 and 350: 0052350 / ANEXOCuadro 9Matriculaci
- Page 351 and 352: 0025352 / ANEXOCuadro 9 (continuaci
- Page 353 and 354: 0052354 / ANEXOCuadro 9 (continuaci
- Page 355 and 356: 50356 / ANEXO02Cuadro 9 (continuaci
- Page 357 and 358: 358 / ANEXO0502Informe de Seguimien
- Page 359 and 360: 50360 / ANEXO02Informe de Seguimien
- Page 361: 50362 / ANEXO02Informe de Seguimien
- Page 365 and 366: 0025366 / ANEXOCuadro 11. Enseñanz
- Page 367 and 368: 50368 / ANEXO02Cuadro 11 (continuac
- Page 369 and 370: 50370 / ANEXO02Informe de Seguimien
- Page 371 and 372: 50372 / ANEXO02Informe de Seguimien
- Page 373 and 374: 50374 / ANEXO02Informe de Seguimien
- Page 375 and 376: 50376 / ANEXO02Informe de Seguimien
- Page 377 and 378: 378 / ANEXO0502Cuadro 13APersonal d
- Page 379 and 380: 50380 / ANEXO02Informe de Seguimien
- Page 381 and 382: 50382 / ANEXO02Informe de Seguimien
- Page 383 and 384: Informe de Seguimiento de la Educac
- Page 385 and 386: 0025386 / ANEXOCuadro 13BPersonal d
- Page 387 and 388: 50388 / ANEXO02Cuadro 13B (continua
- Page 389 and 390: 05390 / ANEXO02Cuadro 13B (continua
- Page 391 and 392: 50392 / ANEXO02Cuadro 13B (continua
- Page 393 and 394: 0025394 / ANEXOCuadro 14. Escolariz
- Page 395 and 396: 50396 / ANEXO02Informe de Seguimien
- Page 397 and 398: 05398 / ANEXO02Informe de Seguimien
- Page 399 and 400: 50400 / ANEXO02Informe de Seguimien
- Page 401 and 402: 2 0 0Informe de Seguimiento de la E
- Page 403 and 404: 50404 / ANEXO02Cuadro 15 (continuac
- Page 405 and 406: 50406 / ANEXO02Cuadro 15 (continuac
- Page 407 and 408: 50408 / ANEXO02Cuadro 15 (continuac
- Page 409 and 410: 0025410 / ANEXOCuadro 16. Evolució
- Page 411 and 412: 05412 / ANEXO02Cuadro 16 (continuac
- Page 413 and 414:
50414 / ANEXO02Cuadro 16 (continuac
- Page 415 and 416:
50416 / ANEXO02Cuadro 16 (continuac
- Page 417 and 418:
0502418 / ANEXOCuadro 17. Evolució
- Page 419 and 420:
50420 / ANEXO02Informe de Seguimien
- Page 421 and 422:
50422 / ANEXO02Informe de Seguimien
- Page 423 and 424:
50424 / ANEXO02Informe de Seguimien
- Page 425 and 426:
20Informe de Seguimiento de la Educ
- Page 427 and 428:
20Informe de Seguimiento de la Educ
- Page 429 and 430:
20Informe de Seguimiento de la Educ
- Page 431 and 432:
005432 / ANEXO2Informe de Seguimien
- Page 433 and 434:
005434 / ANEXO2Informe de Seguimien
- Page 435 and 436:
005436 / ANEXO2Informe de Seguimien
- Page 437 and 438:
005438 / ANEXO2Informe de Seguimien
- Page 439 and 440:
005440 / ANEXO2Informe de Seguimien
- Page 441 and 442:
005442 / ANEXO2Informe de Seguimien
- Page 443 and 444:
005444 / ANEXO2Informe de Seguimien
- Page 445 and 446:
005446 / ANEXO2Informe de Seguimien
- Page 447 and 448:
005448 / ANEXO2Informe de Seguimien
- Page 449 and 450:
005450 / ANEXO2Informe de Seguimien
- Page 451 and 452:
005452 / ANEXO2Informe de Seguimien
- Page 453 and 454:
005454 / ANEXO2Informe de Seguimien
- Page 455 and 456:
005456 / ANEXO2Informe de Seguimien
- Page 457 and 458:
0205Informe de Seguimiento de la Ed
- Page 459 and 460:
0205460 / ANEXOInforme de Seguimien
- Page 461:
Educación para TodosEL IMPERATIVOD