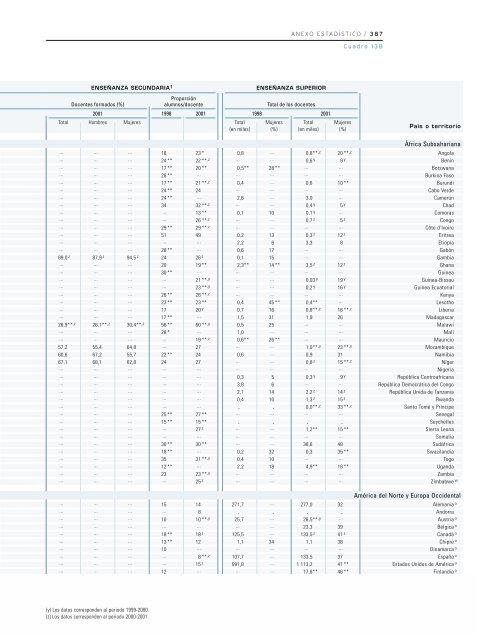
ANEXO ESTADÍSTICO / 387Cuadro 13BENSEÑANZA SECUNDARIA 1ENSEÑANZA SUPERIORDocentes formados (%)2001Total Hombres MujeresProporciónalumnos/docente1998 2001Total(en miles)1998Total <strong>de</strong> los docentesMujeres(%)Total(en miles)2001Mujeres(%)País o territorio... ... ... 18 23,* 0,8 ... 0,8** ,z 20,** ,z... ... ... 24,** 22,** ,z ... ... 0,6, y 9, y... ... ... 17,** 20,** 0,5** 28,** ... ...... ... ... 28,** ... ... ... ... ...... ... ... 17,** 21,** ,z 0,4 ... 0,6 10,**... ... ... 24,** 24 ... ... ... ...... ... ... 24,** ... 2,6 ... 3,0 ...... ... ... 34 32,** ,z ... ... 0,4, y 5, y... ... ... ... 13,** 0,1 10 0,1, y ...... ... ... ... 26,** ,z ... ... 0,7, z 5, z... ... ... 29,** 29,** ,z ... ... ... ...... ... ... 51 49 0,2 13 0,3, z 12, z... ... ... ... ... 2,2 6 3,3 8... ... ... 28,** ... 0,6 17 ... ...89,0, z 87,9, z 94,5, z 24 26, z 0,1 15 ... ...... ... ... 20 19,** 2,3** 14,** 3,5, z 12, z... ... ... 30,** ... ... ... ... ...... ... ... ... 21,** ,y ... ... 0,03, y 19, y... ... ... ... 23,** ,y ... ... 0,2, y 16, y... ... ... 26,** 26,** ,z ... ... ... ...... ... ... 23,** 23,** 0,4 45,** 0,4** ...... ... ... 17 20, y 0,7 16 0,8** ,z 16,** ,z... ... ... 17,** ... 1,5 31 1,9 2626,9** ,z 26,1** ,z 30,4** ,z 56,** 60,** ,y 0,5 25 ... ...... ... ... 28,* ... 1,0 ... ... ...... ... ... ... 19,** ,z 0,6** 26,** ... ...57,2 55,4 64,8 ... 27 ... ... 1,0** ,y 23,** ,y60,6 67,2 55,7 22,** 24 0,6 ... 0,9 3167,1 68,1 62,8 24 27 ... ... 0,8, z 15,** ,z... ... ... ... ... ... ... ... ...... ... ... ... ... 0,3 5 0,3, y 9, y... ... ... ... ... 3,8 6 ... ...... ... ... ... ... 2,1 14 2,2, z 14, z... ... ... ... ... 0,4 10 1,3, z 15, z... ... ... ... ... . . 0,0** ,z 33,** ,z... ... ... 25,** 27,** ... ... ... ...... ... ... 15,** 15,** . . . .... ... ... ... 27, z ... ... 1,2** 15,**... ... ... ... ... ... ... ... ...... ... ... 30,** 30,** ... ... 38,6 48... ... ... 18,** ... 0,2 32 0,3 35,**... ... ... 35 31,** ,y 0,4 10 ... ...... ... ... 12,** ... 2,2 18 4,9** 18,**... ... ... 23 23,** ,y ... ... ... ...... ... ... ... 25, z ... ... ... ...África SubsaharianaAngo<strong>la</strong>BeninBotswanaBurkina FasoBurundiCabo Ver<strong>de</strong>CamerúnChadComorasCongoCôte d’IvoireEritreaEtiopíaGabónGambiaGhanaGuineaGuinea-BissauGuinea EcuatorialKenyaLesothoLiberiaMadagascarMa<strong>la</strong>wiMalíMauricioMozambiqueNamibiaNígerNigeriaRepública CentroafricanaRepública Democrática d<strong>el</strong> CongoRepública Unida <strong>de</strong> TanzaniaRwandaSanto Tomé y PríncipeSenegalSeych<strong>el</strong>lesSierra LeonaSomaliaSudáfricaSwazi<strong>la</strong>ndiaTogoUgandaZambiaZimbabwe w... ... ... 15 14 271,7 ... 277,0 32... ... ... ... 8 . . . .... ... ... 10 10,** ,y 25,7 ... 26,5** ,y ...... ... ... ... ... ... ... 23,3 39... ... ... 18,** 18, z 125,5 ... 133,5, z 41, z... ... ... 13,** 12 1,1 34 1,1 38... ... ... 10 ... ... ... ... ...... ... ... ... 8,** ,z 107,7 ... 133,5 37... ... ... ... 15, z 991,8 ... 1 113,2 41,**... ... ... 12 ... ... ... 17,6** 46,**América d<strong>el</strong> Norte y Europa Occi<strong>de</strong>ntalAlemania oAndorraAustria oBélgica oCanadá oChipre oDinamarca oEspaña oEstados Unidos <strong>de</strong> América oFin<strong>la</strong>ndia o(y) Los datos correspon<strong>de</strong>n al periodo 1999-2000.(z) Los datos correspon<strong>de</strong>n al periodo 2000-2001.
50388 / ANEXO02Cuadro 13B (continuación)ENSEÑANZA SECUNDARIA 1<strong>Informe</strong> <strong>de</strong> Seguimiento <strong>de</strong> <strong>la</strong> Educación <strong>para</strong> Todos en <strong>el</strong> MundoPaís o territorioFrancia oGrecia oIr<strong>la</strong>nda oIs<strong>la</strong>ndia oIsra<strong>el</strong> oItalia oLuxemburgo oMalta oMónacoNoruega oPaíses Bajos oPortugal oReino Unido oSan MarinoSuecia oSuiza oAmérica Latina y <strong>el</strong> CaribeAngui<strong>la</strong>Antigua y BarbudaAntil<strong>la</strong>s Neer<strong>la</strong>n<strong>de</strong>sasArgentina wArubaBahamasBarbadosB<strong>el</strong>iceBermudasBoliviaBrasil wChile wColombiaCosta RicaCubaDominicaEcuadorEl SalvadorGranadaGuatema<strong>la</strong>GuyanaHaitíHondurasIs<strong>la</strong>s CaimánIs<strong>la</strong>s Turcos y CaicosIs<strong>la</strong>s Vírgenes BritánicasJamaica wMéxico oMontserratNicaraguaPanamáParaguay wPerú wRepública DominicanaSaint Kitts y NevisSan Vicente y <strong>la</strong>s GranadinasSanta LucíaSurinameTrinidad y TobagoUruguay wVenezu<strong>el</strong>aTotal(en miles)1998Total <strong>de</strong> los docentesMujeres(%)2001Total(en miles)Mujeres(%)Docentes formados (%)495,2 57 510,5 57 ... ... ...74,7 ... 84,3 ... ... ... ...... ... ... ... ... ... ...2,5** 58,** 2,6** ,y 58,** ,y ... ... ...54,9 ... 72,4, z 72, z ... ... ...422,1 65 440,7 65 ... ... ...... ... 3,2** 42,** ... ... ...3,6 48 3,7 54 ... ... ...0,4** 60,** 0,3, z 58, z ... ... ...... ... ... ... ... ... ...... ... 103,8** 42,** ... ... ...... ... 89,6 69,** ... ... ...469,5 56 471,4, z 59, z ... ... ...... ... ... ... ... ... ...63,1 ... 70,2 ... ... ... ...50,3 39 48,0** 40,** ... ... ...0,1** 65,** 0,1** 63,** 60,0** 65,2** 57,1**... ... 0,4, y 71, y ... ... ...1,0 53 1,2** 55,** 100,0 100,0 100,0257,8 69 321,2** ... ... ... ...0,4** 49,** 0,4** 49,** 100,0** 100,0** 100,0**... ... 2,1 67 ... ... ...1,2** 58,** 1,3** 49,** 63,8** 63,2** 64,3**0,9** 62,** 1,1, z 65, z ... ... ...... ... 0,7 67 ... ... ...... ... 37,5** 53,** ... ... ...... ... 1 367,5 78 ... ... ...... ... 47,4, z 63, z ... ... ...... ... 177,2** 51,** ... ... ...... ... 14,3 53 ... ... ...64,9 61 77,0 58 94,4 94,5 94,40,3** 68,** 0,4 67 29,9** 26,9** 31,3**53,9** 50,** 71,2 49 ... ... ...... ... 7,3, z ... ... ... ...... ... 0,3 90,** ... ... ...27,2* ... 40,0 ... ... ... ...3,6** 63,** 3,8** ,y 60,** ,y 58,2** 59,2** 57,6**... ... ... ... ... ... ...... ... ... ... ... ... ...0,2** 52,** 0,2** 55,** ... ... ...0,1** 61,** 0,1** 61,** ... ... ...0,1** 62,** 0,2** 63,** ... ... ...... ... 11,8** 67,** ... ... ...... ... 571,4 45,** ... ... ...0,03** 69,** 0,03** 55,** ... ... ...7,7* 58,* 10,6* 62,* 44,2* 35,8* 50,4*14,3** 55,** 15,2 56 ... ... ...... ... 38,7 62 ... ... ...128,4** 41,** 114,4** ,z 44,** ,z ... ... ...22,1** 58,** 23,9** 74,** ... ... ...... ... 0,4** 61,** ... ... ...... ... 0,4** 60,** ... ... ...0,7** 64,** 0,7** 64,** ... ... ...... ... 2,8 68,** ... ... ...5,4** 59,** 6,0** 59,** 55,7** 59,2** 53,2**15,9 ... 22,5 ... ... ... ...... ... ... ... ... ... ...1998Total Hombres Mujeres1. Compren<strong>de</strong> <strong>el</strong> primer y segundo ciclo <strong>de</strong> <strong>la</strong> enseñanza secundaria, que correspon<strong>de</strong>n a los niv<strong>el</strong>es 2 y 3 <strong>de</strong> <strong>la</strong> CINE, respectivamente.
- Page 1 and 2:
Informe de Seguimientode la EPT en
- Page 3 and 4:
Educación para TodosEL IMPERATIVOD
- Page 5 and 6:
PrefacioTratar de lograr la Educaci
- Page 7 and 8:
AgradecimientosEl equipo que prepar
- Page 9 and 10:
ÍndiceMensajes principales . . . .
- Page 13 and 14:
2.6: Distribución porcentual del e
- Page 15 and 16:
3.10: Relación entre las competenc
- Page 17 and 18:
Informe de Seguimiento de la Educac
- Page 19 and 20:
calidad para todosUn mejor aprendiz
- Page 21 and 22:
Informe de Seguimiento de la Educac
- Page 23 and 24:
RESUMEN DEL INFORME / 23Por último
- Page 25 and 26:
RESUMEN DEL INFORME / 25debido tiem
- Page 27 and 28:
RESUMEN DEL INFORME / 27Datos exact
- Page 29 and 30:
Informe de Seguimiento de la Educac
- Page 31 and 32:
ENTENDER QUÉ ES LA CALIDAD DE LA E
- Page 33 and 34:
ENTENDER QUÉ ES LA CALIDAD DE LA E
- Page 35 and 36:
ENTENDER QUÉ ES LA CALIDAD DE LA E
- Page 37 and 38:
ENTENDER QUÉ ES LA CALIDAD DE LA E
- Page 39 and 40:
ENTENDER QUÉ ES LA CALIDAD DE LA E
- Page 41 and 42:
ENTENDER QUÉ ES LA CALIDAD DE LA E
- Page 43 and 44:
Informe de Seguimiento de la Educac
- Page 45 and 46:
LA IMPORTANCIA DE LA CALIDAD: ENSE
- Page 47 and 48:
LA IMPORTANCIA DE LA CALIDAD: ENSE
- Page 49 and 50:
LA IMPORTANCIA DE LA CALIDAD: ENSE
- Page 51 and 52:
LA IMPORTANCIA DE LA CALIDAD: ENSE
- Page 53 and 54:
LA IMPORTANCIA DE LA CALIDAD: ENSE
- Page 55 and 56:
LA IMPORTANCIA DE LA CALIDAD: ENSE
- Page 57 and 58:
LA IMPORTANCIA DE LA CALIDAD: ENSE
- Page 59 and 60:
LA IMPORTANCIA DE LA CALIDAD: ENSE
- Page 61 and 62:
LA IMPORTANCIA DE LA CALIDAD: ENSE
- Page 63 and 64:
LA IMPORTANCIA DE LA CALIDAD: ENSE
- Page 65 and 66:
LA IMPORTANCIA DE LA CALIDAD: ENSE
- Page 67 and 68:
LA IMPORTANCIA DE LA CALIDAD: ENSE
- Page 69 and 70:
LA IMPORTANCIA DE LA CALIDAD: ENSE
- Page 71 and 72:
LA IMPORTANCIA DE LA CALIDAD: ENSE
- Page 73 and 74:
LA IMPORTANCIA DE LA CALIDAD: ENSE
- Page 75 and 76:
LA IMPORTANCIA DE LA CALIDAD: ENSE
- Page 77 and 78:
LA IMPORTANCIA DE LA CALIDAD: ENSE
- Page 79 and 80:
LA IMPORTANCIA DE LA CALIDAD: ENSE
- Page 81 and 82:
LA IMPORTANCIA DE LA CALIDAD: ENSE
- Page 83 and 84:
LA IMPORTANCIA DE LA CALIDAD: ENSE
- Page 85 and 86:
LA IMPORTANCIA DE LA CALIDAD: ENSE
- Page 87 and 88:
LA IMPORTANCIA DE LA CALIDAD: ENSE
- Page 89 and 90:
LA IMPORTANCIA DE LA CALIDAD: ENSE
- Page 91 and 92:
Informe de Seguimiento de la Educac
- Page 93 and 94:
EVALUACIÓN DE LOS PROGRESOS HACIA
- Page 95 and 96:
EVALUACIÓN DE LOS PROGRESOS HACIA
- Page 97 and 98:
EVALUACIÓN DE LOS PROGRESOS HACIA
- Page 99 and 100:
EVALUACIÓN DE LOS PROGRESOS HACIA
- Page 101 and 102:
EVALUACIÓN DE LOS PROGRESOS HACIA
- Page 103 and 104:
EVALUACIÓN DE LOS PROGRESOS HACIA
- Page 105 and 106:
EVALUACIÓN DE LOS PROGRESOS HACIA
- Page 107 and 108:
EVALUACIÓN DE LOS PROGRESOS HACIA
- Page 109 and 110:
EVALUACIÓN DE LOS PROGRESOS HACIA
- Page 111 and 112:
EVALUACIÓN DE LOS PROGRESOS HACIA
- Page 113 and 114:
EVALUACIÓN DE LOS PROGRESOS HACIA
- Page 115 and 116:
EVALUACIÓN DE LOS PROGRESOS HACIA
- Page 117 and 118:
EVALUACIÓN DE LOS PROGRESOS HACIA
- Page 119 and 120:
EVALUACIÓN DE LOS PROGRESOS HACIA
- Page 121 and 122:
EVALUACIÓN DE LOS PROGRESOS HACIA
- Page 123 and 124:
EVALUACIÓN DE LOS PROGRESOS HACIA
- Page 125 and 126:
EVALUACIÓN DE LOS PROGRESOS HACIA
- Page 127 and 128:
EVALUACIÓN DE LOS PROGRESOS HACIA
- Page 129 and 130:
EVALUACIÓN DE LOS PROGRESOS HACIA
- Page 131 and 132:
EVALUACIÓN DE LOS PROGRESOS HACIA
- Page 133 and 134:
EVALUACIÓN DE LOS PROGRESOS HACIA
- Page 135 and 136:
EVALUACIÓN DE LOS PROGRESOS HACIA
- Page 137 and 138:
EVALUACIÓN DE LOS PROGRESOS HACIA
- Page 139 and 140:
EVALUACIÓN DE LOS PROGRESOS HACIA
- Page 141 and 142:
EVALUACIÓN DE LOS PROGRESOS HACIA
- Page 143 and 144:
EVALUACIÓN DE LOS PROGRESOS HACIA
- Page 145 and 146:
EVALUACIÓN DE LOS PROGRESOS HACIA
- Page 147 and 148:
EVALUACIÓN DE LOS PROGRESOS HACIA
- Page 149 and 150:
EVALUACIÓN DE LOS PROGRESOS HACIA
- Page 151 and 152:
EVALUACIÓN DE LOS PROGRESOS HACIA
- Page 153 and 154:
EVALUACIÓN DE LOS PROGRESOS HACIA
- Page 155 and 156:
EVALUACIÓN DE LOS PROGRESOS HACIA
- Page 157 and 158:
EVALUACIÓN DE LOS PROGRESOS HACIA
- Page 159 and 160:
Informe de Seguimiento de la Educac
- Page 161 and 162:
POLÍTICAS PARA MEJORAR LA CALIDAD
- Page 163 and 164:
POLÍTICAS PARA MEJORAR LA CALIDAD
- Page 165 and 166:
POLÍTICAS PARA MEJORAR LA CALIDAD
- Page 167 and 168:
POLÍTICAS PARA MEJORAR LA CALIDAD
- Page 169 and 170:
POLÍTICAS PARA MEJORAR LA CALIDAD
- Page 171 and 172:
POLÍTICAS PARA MEJORAR LA CALIDAD
- Page 173 and 174:
POLÍTICAS PARA MEJORAR LA CALIDAD
- Page 175 and 176:
POLÍTICAS PARA MEJORAR LA CALIDAD
- Page 177 and 178:
POLÍTICAS PARA MEJORAR LA CALIDAD
- Page 179 and 180:
POLÍTICAS PARA MEJORAR LA CALIDAD
- Page 181 and 182:
POLÍTICAS PARA MEJORAR LA CALIDAD
- Page 183 and 184:
POLÍTICAS PARA MEJORAR LA CALIDAD
- Page 185 and 186:
POLÍTICAS PARA MEJORAR LA CALIDAD
- Page 187 and 188:
POLÍTICAS PARA MEJORAR LA CALIDAD
- Page 189 and 190:
POLÍTICAS PARA MEJORAR LA CALIDAD
- Page 191 and 192:
POLÍTICAS PARA MEJORAR LA CALIDAD
- Page 193 and 194:
POLÍTICAS PARA MEJORAR LA CALIDAD
- Page 195 and 196:
POLÍTICAS PARA MEJORAR LA CALIDAD
- Page 197 and 198:
POLÍTICAS PARA MEJORAR LA CALIDAD
- Page 199 and 200:
POLÍTICAS PARA MEJORAR LA CALIDAD
- Page 201 and 202:
POLÍTICAS PARA MEJORAR LA CALIDAD
- Page 203 and 204:
POLÍTICAS PARA MEJORAR LA CALIDAD
- Page 205 and 206:
POLÍTICAS PARA MEJORAR LA CALIDAD
- Page 207 and 208:
POLÍTICAS PARA MEJORAR LA CALIDAD
- Page 209 and 210:
Informe de Seguimiento de la Educac
- Page 211 and 212:
CUMPLIR NUESTROS COMPROMISOS INTERN
- Page 213 and 214:
CUMPLIR NUESTROS COMPROMISOS INTERN
- Page 215 and 216:
CUMPLIR NUESTROS COMPROMISOS INTERN
- Page 217 and 218:
CUMPLIR NUESTROS COMPROMISOS INTERN
- Page 219 and 220:
CUMPLIR NUESTROS COMPROMISOS INTERN
- Page 221 and 222:
CUMPLIR NUESTROS COMPROMISOS INTERN
- Page 223 and 224:
CUMPLIR NUESTROS COMPROMISOS INTERN
- Page 225 and 226:
CUMPLIR NUESTROS COMPROMISOS INTERN
- Page 227 and 228:
CUMPLIR NUESTROS COMPROMISOS INTERN
- Page 229 and 230:
CUMPLIR NUESTROS COMPROMISOS INTERN
- Page 231 and 232:
CUMPLIR NUESTROS COMPROMISOS INTERN
- Page 233 and 234:
CUMPLIR NUESTROS COMPROMISOS INTERN
- Page 235 and 236:
CUMPLIR NUESTROS COMPROMISOS INTERN
- Page 237 and 238:
CUMPLIR NUESTROS COMPROMISOS INTERN
- Page 239 and 240:
CUMPLIR NUESTROS COMPROMISOS INTERN
- Page 241 and 242:
CUMPLIR NUESTROS COMPROMISOS INTERN
- Page 243 and 244:
CUMPLIR NUESTROS COMPROMISOS INTERN
- Page 245 and 246:
CUMPLIR NUESTROS COMPROMISOS INTERN
- Page 247 and 248:
CUMPLIR NUESTROS COMPROMISOS INTERN
- Page 249 and 250:
Informe de Seguimiento de la Educac
- Page 251 and 252:
HACIA LA EDUCACIÓN PARA TODOS: EL
- Page 253 and 254:
HACIA LA EDUCACIÓN PARA TODOS: EL
- Page 255 and 256:
HACIA LA EDUCACIÓN PARA TODOS: EL
- Page 257 and 258:
HACIA LA EDUCACIÓN PARA TODOS: EL
- Page 259 and 260:
HACIA LA EDUCACIÓN PARA TODOS: EL
- Page 261 and 262:
Informe de Seguimiento de la Educac
- Page 263 and 264:
005264 / ANEXO2Informe de Seguimien
- Page 265 and 266:
005266 / ANEXO2Informe de Seguimien
- Page 267 and 268:
050268 / ANEXO2Informe de Seguimien
- Page 269 and 270:
005270 / ANEXO2Informe de Seguimien
- Page 271 and 272:
005272 / ANEXO2Informe de Seguimien
- Page 273 and 274:
005274 / ANEXO2Cuadro A1: El Índic
- Page 275 and 276:
50276 / ANEXO02Cuadro A2: Clasifica
- Page 277 and 278:
2005278 / ANEXOInforme de Seguimien
- Page 279 and 280:
0025280 / ANEXOInforme de Seguimien
- Page 281 and 282:
0025282 / ANEXOInforme de Seguimien
- Page 283 and 284:
50284 / ANEXO02Años de referencia
- Page 285 and 286:
2 0 0Informe de Seguimiento de la E
- Page 287 and 288:
5002288 / ANEXOCuadro 1 (continuaci
- Page 289 and 290:
5002290 / ANEXOCuadro 1 (continuaci
- Page 291 and 292:
5002292 / ANEXOCuadro 1 (continuaci
- Page 293 and 294:
0502294 / ANEXOCuadro 2Alfabetizaci
- Page 295 and 296:
50296 / ANEXO02Informe de Seguimien
- Page 297 and 298:
50298 / ANEXO02Informe de Seguimien
- Page 299 and 300:
50300 / ANEXO02Informe de Seguimien
- Page 301 and 302:
5002302 / ANEXOCuadro 3Atención y
- Page 303 and 304:
50304 / ANEXO02Informe de Seguimien
- Page 305 and 306:
005306 / ANEXO2Informe de Seguimien
- Page 307 and 308:
52 0 0Informe de Seguimiento de la
- Page 309 and 310:
5002310 / ANEXOCuadro 4Acceso a la
- Page 311 and 312:
50312 / ANEXO02Informe de Seguimien
- Page 313 and 314:
05314 / ANEXO02Informe de Seguimien
- Page 315 and 316:
50316 / ANEXO02Informe de Seguimien
- Page 317 and 318:
0025318 / ANEXOCuadro 5Participaci
- Page 319 and 320:
50320 / ANEXO02Informe de Seguimien
- Page 321 and 322:
50322 / ANEXO02Informe de Seguimien
- Page 323 and 324:
50324 / ANEXO02Informe de Seguimien
- Page 325 and 326:
5002326 / ANEXOCuadro 6Eficacia int
- Page 327 and 328:
0025328 / ANEXOCuadro 6 (continuaci
- Page 329 and 330:
5002330 / ANEXOCuadro 6 (continuaci
- Page 331 and 332:
5002332 / ANEXOCuadro 6 (continuaci
- Page 333 and 334:
0334 / ANEXO025Cuadro 7. Eficacia i
- Page 335 and 336: 50336 / ANEXO02Cuadro 7 (continuaci
- Page 337 and 338: 05338 / ANEXO02Cuadro 7 (continuaci
- Page 339 and 340: 50340 / ANEXO02Cuadro 7 (continuaci
- Page 341 and 342: 050342 / ANEXO2Cuadro 8. Participac
- Page 343 and 344: 2 0 0Informe de Seguimiento de la E
- Page 345 and 346: 2 0 0Informe de Seguimiento de la E
- Page 347 and 348: 52 0 0Informe de Seguimiento de la
- Page 349 and 350: 0052350 / ANEXOCuadro 9Matriculaci
- Page 351 and 352: 0025352 / ANEXOCuadro 9 (continuaci
- Page 353 and 354: 0052354 / ANEXOCuadro 9 (continuaci
- Page 355 and 356: 50356 / ANEXO02Cuadro 9 (continuaci
- Page 357 and 358: 358 / ANEXO0502Informe de Seguimien
- Page 359 and 360: 50360 / ANEXO02Informe de Seguimien
- Page 361 and 362: 50362 / ANEXO02Informe de Seguimien
- Page 363 and 364: 50364 / ANEXO02Informe de Seguimien
- Page 365 and 366: 0025366 / ANEXOCuadro 11. Enseñanz
- Page 367 and 368: 50368 / ANEXO02Cuadro 11 (continuac
- Page 369 and 370: 50370 / ANEXO02Informe de Seguimien
- Page 371 and 372: 50372 / ANEXO02Informe de Seguimien
- Page 373 and 374: 50374 / ANEXO02Informe de Seguimien
- Page 375 and 376: 50376 / ANEXO02Informe de Seguimien
- Page 377 and 378: 378 / ANEXO0502Cuadro 13APersonal d
- Page 379 and 380: 50380 / ANEXO02Informe de Seguimien
- Page 381 and 382: 50382 / ANEXO02Informe de Seguimien
- Page 383 and 384: Informe de Seguimiento de la Educac
- Page 385: 0025386 / ANEXOCuadro 13BPersonal d
- Page 389 and 390: 05390 / ANEXO02Cuadro 13B (continua
- Page 391 and 392: 50392 / ANEXO02Cuadro 13B (continua
- Page 393 and 394: 0025394 / ANEXOCuadro 14. Escolariz
- Page 395 and 396: 50396 / ANEXO02Informe de Seguimien
- Page 397 and 398: 05398 / ANEXO02Informe de Seguimien
- Page 399 and 400: 50400 / ANEXO02Informe de Seguimien
- Page 401 and 402: 2 0 0Informe de Seguimiento de la E
- Page 403 and 404: 50404 / ANEXO02Cuadro 15 (continuac
- Page 405 and 406: 50406 / ANEXO02Cuadro 15 (continuac
- Page 407 and 408: 50408 / ANEXO02Cuadro 15 (continuac
- Page 409 and 410: 0025410 / ANEXOCuadro 16. Evolució
- Page 411 and 412: 05412 / ANEXO02Cuadro 16 (continuac
- Page 413 and 414: 50414 / ANEXO02Cuadro 16 (continuac
- Page 415 and 416: 50416 / ANEXO02Cuadro 16 (continuac
- Page 417 and 418: 0502418 / ANEXOCuadro 17. Evolució
- Page 419 and 420: 50420 / ANEXO02Informe de Seguimien
- Page 421 and 422: 50422 / ANEXO02Informe de Seguimien
- Page 423 and 424: 50424 / ANEXO02Informe de Seguimien
- Page 425 and 426: 20Informe de Seguimiento de la Educ
- Page 427 and 428: 20Informe de Seguimiento de la Educ
- Page 429 and 430: 20Informe de Seguimiento de la Educ
- Page 431 and 432: 005432 / ANEXO2Informe de Seguimien
- Page 433 and 434: 005434 / ANEXO2Informe de Seguimien
- Page 435 and 436: 005436 / ANEXO2Informe de Seguimien
- Page 437 and 438:
005438 / ANEXO2Informe de Seguimien
- Page 439 and 440:
005440 / ANEXO2Informe de Seguimien
- Page 441 and 442:
005442 / ANEXO2Informe de Seguimien
- Page 443 and 444:
005444 / ANEXO2Informe de Seguimien
- Page 445 and 446:
005446 / ANEXO2Informe de Seguimien
- Page 447 and 448:
005448 / ANEXO2Informe de Seguimien
- Page 449 and 450:
005450 / ANEXO2Informe de Seguimien
- Page 451 and 452:
005452 / ANEXO2Informe de Seguimien
- Page 453 and 454:
005454 / ANEXO2Informe de Seguimien
- Page 455 and 456:
005456 / ANEXO2Informe de Seguimien
- Page 457 and 458:
0205Informe de Seguimiento de la Ed
- Page 459 and 460:
0205460 / ANEXOInforme de Seguimien
- Page 461:
Educación para TodosEL IMPERATIVOD