- Page 3:
' ! "#$#% %#&' ()( !* + !, '-! ! "
- Page 7:
+ , - . /$ 0$ % 1 -!%#2#!'"(* # $ %
- Page 10 and 11:
3 : B ! $ $ , & 3 + , ! ! & / + CB
- Page 12 and 13:
$ & > ! ! ? + 8 & / 4 H ! $ ! - ' !
- Page 14:
, / + $ / . ! ) 8 . . & ! $ - ! ! +
- Page 19 and 20:
'-#%! -!) ('%!*#&' -! )(* -! !%F(*
- Page 21 and 22:
5 @A!"#B(* -! ) "! % ' < 32 < 4 ! !
- Page 23 and 24:
% ' < 32 < 4 + ! ! ! & & - ' ! 8 .
- Page 25 and 26:
% ' < 32 < 4 8 #'2#1 %#&': 4' % -!'
- Page 27 and 28:
% ' < 32 < 4 ( $ $ & $ ! , 98 & ! )
- Page 29 and 30:
% ' < 32 < 4 J< C 6 " ) , 73 " ( &
- Page 31 and 32:
% ' < 32 < 4 / / / $ + 8 $ / + - '
- Page 33 and 34:
% ' < 32 < 4 TRABAJADORES EXTRANJER
- Page 35 and 36:
% ' < 32 < 4 > $ - % ) - 9 $ ) ! &
- Page 37 and 38:
% ' < 32 < 4 L-E:1 - - ( 9! / ! ! ,
- Page 39 and 40:
% ' < 32 < 4 L L L K L 7665 C- L< C
- Page 41 and 42:
% ' < 32 < 4 L P 95 P >H 7 G- :E :C
- Page 43 and 44:
% ' < 32 < 4 / ! 7 ) A& ) L + ;B 3
- Page 45 and 46:
% ' < 32 < 4 ! - & C< , ! & & 9! $
- Page 47 and 48:
% ' < 32 < 4 ! ) ! / - & A:;;; ;B ,
- Page 49 and 50:
% ' < 32 < 4 + ! ) / 8 , > / $ $ !
- Page 51 and 52:
% ' < 32 < 4 J< > ? / ! > / $ ! & )
- Page 53 and 54:
% ' < 32 < 4 ! " + ! 8 + ! ) - 2 2
- Page 55 and 56:
% ' < 32 < 4 E #'2#1 %#&' !' *< : !
- Page 57 and 58:
% ' < 32 < 4 - ' ! $ ) ) ! ) 9 A <
- Page 59 and 60:
% ' < 32 < 4 ! " ($ :;;E 4 " - + /
- Page 61 and 62:
% ' < 32 < 4 . L< - ! " ! " Y Z+ CL
- Page 63 and 64:
% ' < 32 < 4 4 ! * 3 - 8 / ! 4 /6 !
- Page 65 and 66:
% ' < 32 < 4 ( ' 1 Q 8 + : Q A, ! $
- Page 67 and 68:
% ' < 32 < 4 + ! + C . 9 > P ? ! "
- Page 69 and 70:
% ' < 32 < 4 =H< . O $ ! 4 ) / )" +
- Page 71 and 72:
60 50 40 30 20 10 0 5,0 6,4 Reino U
- Page 73 and 74:
% ' < 32 < 4 " ! / ) ! , = = ) :;Q
- Page 75 and 76:
% ' < 32 < 4 # + / ! + 1 + 9 + ! !
- Page 77 and 78:
1.200 1.000 800 600 400 200 0 % ' <
- Page 79 and 80:
% ' < 32 < 4 ? 5 #B! G ('B#B! E : 2
- Page 81 and 82:
% ' < 32 < 4 / , 4 + , ( . ) - ? 7
- Page 83 and 84:
% ' < 32 < 4 ' ! 3 4 ! : ! " $ ! P6
- Page 85 and 86:
% ' < 32 < 4 ! & & : 3 - 9! ) 6 ! $
- Page 87 and 88:
% ' < 32 < 4 ? E 2< -! %(1#- )#'2#1
- Page 89 and 90:
% ' < 32 < 4 - ( ! ) ! ) 7 % $ + !
- Page 91 and 92:
% ' < 32 < 4 ( ! & , & 9 $ - ! ! P
- Page 93 and 94:
% ' < 32 < 4 AG 9< -B $ C- "! ! $ 8
- Page 95 and 96:
% ' < 32 < 4 ' & & + / / ! 8 / $ !
- Page 97 and 98:
% ' < 32 < 4 ! P ! ) & ! + 9 ) L -
- Page 99 and 100:
: B- 3.975; 20% 5.398; 27% % ' < 32
- Page 101 and 102:
6.000 5.000 4.000 3.000 2.000 1.000
- Page 103 and 104:
% ' < 32 < 4 / . ?0 % @ 6 ( ' 1 > 8
- Page 105 and 106:
% ' < 32 < 4 ' ! 3 ! $ 4 8 * + ! /
- Page 107 and 108:
% ' < 32 < 4 + ! 9 / 8 - ! + & ( .
- Page 109 and 110:
LL - % ' < 32 < 4 4 + ! ! & + ! ! )
- Page 111 and 112:
% ' < 32 < 4 > K7 ! / &" 1 ?- A' 2
- Page 113 and 114:
% ' < 32 < 4 >F / " 1. 8 / ! ) ! $
- Page 115 and 116:
% ' < 32 < 4 # ) ) : LQ :C LQ 9! 4
- Page 117 and 118:
% ' < 32 < 4 6 J< % , =>>B$ < 8 : <
- Page 119 and 120:
% ' < 32 < 4 . ! + , / " >: 8 C8 C
- Page 121 and 122:
$ - % ' < 32 < 4 $ ! P + , & & : Q
- Page 123 and 124:
?- % ' < 32 < 4 ! 4 ) - & , . >:E8
- Page 125 and 126:
% ' < 32 < 4 H 8 5 '"! '!"%(2( 2!-#
- Page 127 and 128:
% ' < 32 < 4 / " & 4& 6 4 8 ! ) / $
- Page 129 and 130:
% ' < 32 < 4 E>< 8 $ ) 1 % $ > 7 )
- Page 131 and 132:
% ' < 32 < 4 - ' / 3 " ) ) ! / ! +
- Page 133:
% ' < 32 < 4 # + ! ! $ ! ! 4 8 , ,
- Page 136 and 137:
; / C ! 3 > ! $ ?------------------
- Page 139 and 140:
'-#%! -! "@)* ) : 4 " - ! . , - % )
- Page 141:
CAPITULO II RESPUESTA EDUCATIVA Y E
- Page 144 and 145:
Índice del Capítulo II 5.7.1 Mode
- Page 147 and 148:
Capítulo II: Respuesta educativa y
- Page 149 and 150:
Capítulo II: Respuesta educativa y
- Page 151 and 152:
Capítulo II: Respuesta educativa y
- Page 153 and 154:
Capítulo II: Respuesta educativa y
- Page 155 and 156:
Capítulo II: Respuesta educativa y
- Page 157 and 158:
Capítulo II: Respuesta educativa y
- Page 159 and 160:
Capítulo II: Respuesta educativa y
- Page 161 and 162:
Capítulo II: Respuesta educativa y
- Page 163 and 164: Capítulo II: Respuesta educativa y
- Page 165 and 166: Capítulo II: Respuesta educativa y
- Page 167 and 168: Capítulo II: Respuesta educativa y
- Page 169 and 170: Capítulo II: Respuesta educativa y
- Page 171 and 172: Capítulo II: Respuesta educativa y
- Page 173 and 174: Capítulo II: Respuesta educativa y
- Page 175 and 176: Capítulo II: Respuesta educativa y
- Page 177 and 178: Capítulo II: Respuesta educativa y
- Page 179 and 180: Capítulo II: Respuesta educativa y
- Page 181 and 182: Capítulo II: Respuesta educativa y
- Page 183 and 184: Capítulo II: Respuesta educativa y
- Page 185 and 186: Capítulo II: Respuesta educativa y
- Page 187 and 188: Capítulo II: Respuesta educativa y
- Page 189 and 190: Capítulo II: Respuesta educativa y
- Page 191 and 192: Capítulo II: Respuesta educativa y
- Page 193 and 194: Capítulo II: Respuesta educativa y
- Page 195 and 196: Capítulo II: Respuesta educativa y
- Page 197 and 198: ETAPAS E.Infantil/ Preescolar E. Pr
- Page 199 and 200: Capítulo II: Respuesta educativa y
- Page 201 and 202: Capítulo II: Respuesta educativa y
- Page 203 and 204: Capítulo II: Respuesta educativa y
- Page 205 and 206: Capítulo II: Respuesta educativa y
- Page 207 and 208: Capítulo II: Respuesta educativa y
- Page 209 and 210: Capítulo II: Respuesta educativa y
- Page 211 and 212: 55,0% 50,0% 45,0% 40,0% 35,0% 30,0%
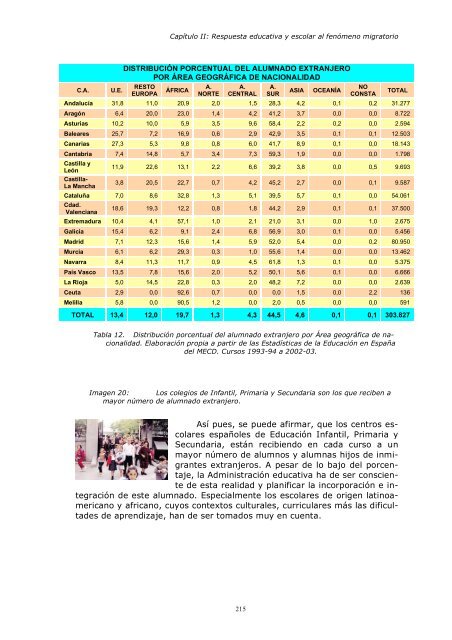
- Page 213: Capítulo II: Respuesta educativa y
- Page 217 and 218: Capítulo II: Respuesta educativa y
- Page 219 and 220: Capítulo II: Respuesta educativa y
- Page 221 and 222: Capítulo II: Respuesta educativa y
- Page 223 and 224: Capítulo II: Respuesta educativa y
- Page 225 and 226: Capítulo II: Respuesta educativa y
- Page 227 and 228: 1.600 1.400 1.200 1.000 800 600 400
- Page 229 and 230: Capítulo II: Respuesta educativa y
- Page 231 and 232: Capítulo II: Respuesta educativa y
- Page 233 and 234: Capítulo II: Respuesta educativa y
- Page 235 and 236: AREAS TOTAL Capítulo II: Respuesta
- Page 237 and 238: Capítulo II: Respuesta educativa y
- Page 239 and 240: Capítulo II: Respuesta educativa y
- Page 241 and 242: Capítulo II: Respuesta educativa y
- Page 243 and 244: Capítulo II: Respuesta educativa y
- Page 245 and 246: Capítulo II: Respuesta educativa y
- Page 247 and 248: Capítulo II: Respuesta educativa y
- Page 249 and 250: Capítulo II: Respuesta educativa y
- Page 251 and 252: Capítulo II: Respuesta educativa y
- Page 253 and 254: Capítulo II: Respuesta educativa y
- Page 255 and 256: Capítulo II: Respuesta educativa y
- Page 257 and 258: Capítulo II: Respuesta educativa y
- Page 259 and 260: Capítulo II: Respuesta educativa y
- Page 261 and 262: Capítulo II: Respuesta educativa y
- Page 263 and 264: Capítulo II: Respuesta educativa y
- Page 265 and 266:
Capítulo II: Respuesta educativa y
- Page 267 and 268:
Capítulo II: Respuesta educativa y
- Page 269 and 270:
Capítulo II: Respuesta educativa y
- Page 271 and 272:
Capítulo II: Respuesta educativa y
- Page 273 and 274:
Capítulo II: Respuesta educativa y
- Page 275 and 276:
Capítulo II: Respuesta educativa y
- Page 277 and 278:
Capítulo II: Respuesta educativa y
- Page 279 and 280:
Capítulo II: Respuesta educativa y
- Page 281 and 282:
Capítulo II: Respuesta educativa y
- Page 283 and 284:
Capítulo II: Respuesta educativa y
- Page 285 and 286:
Capítulo II: Respuesta educativa y
- Page 287 and 288:
Capítulo II: Respuesta educativa y
- Page 289 and 290:
Capítulo II: Respuesta educativa y
- Page 291 and 292:
291 Conclusiones de la parte I pres
- Page 293 and 294:
293 Conclusiones de la parte I - Lo
- Page 295 and 296:
Índice de Imágenes 295 Índice de
- Page 297 and 298:
Índice de Tablas 297 Índice de Ta
- Page 299 and 300:
Índice de Gráficos 299 Índice de
- Page 301 and 302:
301 Índice de Gráficos Gráfico 2
- Page 304:
CAPÍTULO III: LOS ELEMENTOS TÉCNI
- Page 307 and 308:
308 Índice de la Parte II 7.4.2 La
- Page 309 and 310:
310 Índice de la Parte II 2.4.6 Al
- Page 311 and 312:
312 Índice de la Parte II 4.4 Rela
- Page 313 and 314:
Parte II: Estudio empírico do dive
- Page 315 and 316:
Parte II: Estudio empírico Objetiv
- Page 317 and 318:
Parte II: Estudio empírico Tratar
- Page 319 and 320:
Parte II: Estudio empírico En defi
- Page 321 and 322:
Parte II: Estudio empírico Tal y c
- Page 323 and 324:
Parte II: Estudio empírico ciones
- Page 325 and 326:
Parte II: Estudio empírico Murcia,
- Page 327 and 328:
Parte II: Estudio empírico VARIABL
- Page 329 and 330:
Parte II: Estudio empírico La desc
- Page 331 and 332:
Parte II: Estudio empírico En la t
- Page 333 and 334:
Parte II: Estudio empírico La desc
- Page 335 and 336:
Parte II: Estudio empírico El esti
- Page 337 and 338:
Parte II: Estudio empírico En dond
- Page 339 and 340:
Parte II: Estudio empírico POBLACI
- Page 341 and 342:
Parte II: Estudio empírico nador e
- Page 343 and 344:
Parte II: Estudio empírico De igua
- Page 345 and 346:
Parte II: Estudio empírico En cuan
- Page 347 and 348:
Parte II: Estudio empírico DENOMIN
- Page 349 and 350:
Parte II: Estudio empírico - “cl
- Page 351 and 352:
Parte II: Estudio empírico General
- Page 353 and 354:
Parte II: Estudio empírico 9.2 Est
- Page 355 and 356:
Parte II: Estudio empírico nº tot
- Page 358 and 359:
1 Estudio descriptivo (Análisis un
- Page 360 and 361:
361 Capítulo IV: Los resultados lo
- Page 362 and 363:
frecuencia 19 17 15 13 11 9 7 5 3 1
- Page 364 and 365:
Especialidad Lengua extranjera 6,0%
- Page 366 and 367:
367 Capítulo IV: Los resultados Fi
- Page 368 and 369:
5 4,5 4 3,5 3 2,5 2 1,5 1 aceptar a
- Page 370 and 371:
5 4,5 4 3,5 3 2,5 2 1,5 1 presencia
- Page 372 and 373:
373 Capítulo IV: Los resultados Gr
- Page 374 and 375:
" : " y con "E e 375 Capítulo IV:
- Page 376 and 377:
forma co jo lect activida fome adqu
- Page 378 and 379:
5 4,5 4 3,5 3 2,5 2 1,5 1 3,3 exist
- Page 380 and 381:
381 Capítulo IV: Los resultados El
- Page 382 and 383:
5 4,5 4 3,5 3 2,5 2 1,5 1 4,39 homb
- Page 384 and 385:
385 Capítulo IV: Los resultados Si
- Page 386 and 387:
387 Capítulo IV: Los resultados Gr
- Page 388 and 389:
ACTITUDES POR COMUNIDADES AUTÓNOMA
- Page 390 and 391:
"IMPLICACIÓN" ANTE FENÓMENO MIGRA
- Page 392 and 393:
5 4,5 4 3,5 3 2,5 2 1,5 1 Diferenci
- Page 394 and 395:
395 Capítulo IV: Los resultados ce
- Page 396 and 397:
Punt.implicación ante fenómeno mi
- Page 398 and 399:
PAPEL DE LA ESCUELA MULTICULTURAL P
- Page 400 and 401:
P 1 2 3 4 401 Capítulo IV: Los res
- Page 402 and 403:
PAPEL DE LA ESCUELA MULTI- CULTURAL
- Page 404 and 405:
405 Capítulo IV: Los resultados 2.
- Page 406 and 407:
5,00 4,50 4,00 3,50 3,00 2,50 2,00
- Page 408 and 409:
E. Especial E. Física E. infantil
- Page 410 and 411:
NECESIDADES DE FORMACIÓN INTERCULT
- Page 412 and 413:
413 Capítulo IV: Los resultados 2.
- Page 414 and 415:
415 Capítulo IV: Los resultados es
- Page 416 and 417:
417 Capítulo IV: Los resultados De
- Page 418 and 419:
419 Capítulo IV: Los resultados 2.
- Page 420 and 421:
NORMATIVA EN FUNCIÓN DE LA OCUPACI
- Page 422 and 423:
423 Capítulo IV: Los resultados 2.
- Page 424 and 425:
425 Capítulo IV: Los resultados CL
- Page 426 and 427:
427 Capítulo IV: Los resultados ta
- Page 428 and 429:
CLIMA INTERCULTURAL POR CURSO 429 C
- Page 430 and 431:
431 Capítulo IV: Los resultados Lo
- Page 432 and 433:
433 Capítulo IV: Los resultados de
- Page 434 and 435:
5,0 4,5 4,0 3,5 3,0 2,5 2,0 1,5 1,0
- Page 436 and 437:
Comunidad Autónoma Andalucía Arag
- Page 438 and 439:
439 Capítulo IV: Los resultados se
- Page 440 and 441:
CORRELACIONES CON ACTITUDES SIGNIFI
- Page 442 and 443:
I 17 0,398 CORRELACIONES CON “IMP
- Page 444 and 445:
C 26 0,166 445 Capítulo IV: Los re
- Page 446 and 447:
do: CORRELACIONES DE PEARSON CON "N
- Page 448 and 449:
CORRELACIONES DE PEARSON CON "MODAL
- Page 450 and 451:
451 Capítulo IV: Los resultados -
- Page 452 and 453:
453 Capítulo IV: Los resultados -
- Page 454 and 455:
455 Capítulo IV: Los resultados RE
- Page 456 and 457:
457 Capítulo IV: Los resultados 4.
- Page 458 and 459:
Anda lucía Ara gón POR “COMUNID
- Page 460 and 461:
CAPÍTULO V: CONCLUSIONES DEL ESTUD
- Page 462 and 463:
Capítulo V: Conclusiones del Estud
- Page 464 and 465:
Capítulo V: Conclusiones del Estud
- Page 466 and 467:
Capítulo V: Conclusiones del Estud
- Page 468:
Capítulo V: Conclusiones del Estud
- Page 472 and 473:
Índice de Tablas Parte II 473 Índ
- Page 474 and 475:
475 Índice de Tablas Parte II Tabl
- Page 476:
477 Índice de Tablas Parte II Tabl
- Page 479 and 480:
Índice de Gráficos Parte II Gráf
- Page 481:
PARTE III: MODELO FORMATIVO INTERCU
- Page 485 and 486:
Índice de la Parte III 487 Índice
- Page 487 and 488:
489 Índice de la Parte III 2.9.2 M
- Page 489 and 490:
491 Índice de la Parte III Índice
- Page 491 and 492:
Capítulo VI: Propuesta de Modelo I
- Page 493 and 494:
Capítulo VI: Propuesta de Modelo I
- Page 495 and 496:
Capítulo VI: Propuesta de Modelo I
- Page 497 and 498:
Capítulo VI: Propuesta de Modelo I
- Page 499 and 500:
Capítulo VI: Propuesta de Modelo I
- Page 501 and 502:
Capítulo VI: Propuesta de Modelo I
- Page 503 and 504:
Capítulo VI: Propuesta de Modelo I
- Page 505 and 506:
Capítulo VI: Propuesta de Modelo I
- Page 507 and 508:
Capítulo VI: Propuesta de Modelo I
- Page 509 and 510:
Capítulo VI: Propuesta de Modelo I
- Page 511 and 512:
Capítulo VI: Propuesta de Modelo I
- Page 513 and 514:
Capítulo VI: Propuesta de Modelo I
- Page 515 and 516:
Capítulo VI: Propuesta de Modelo I
- Page 517 and 518:
Capítulo VI: Propuesta de Modelo I
- Page 519 and 520:
Capítulo VI: Propuesta de Modelo I
- Page 521 and 522:
Capítulo VI: Propuesta de Modelo I
- Page 523 and 524:
Capítulo VI: Propuesta de Modelo I
- Page 525 and 526:
Capítulo VI: Propuesta de Modelo I
- Page 527 and 528:
Capítulo VI: Propuesta de Modelo I
- Page 529 and 530:
Capítulo VI: Propuesta de Modelo I
- Page 531 and 532:
Capítulo VI: Propuesta de Modelo I
- Page 533 and 534:
Capítulo VI: Propuesta de Modelo I
- Page 535 and 536:
Capítulo VI: Propuesta de Modelo I
- Page 537 and 538:
Capítulo VI: Propuesta de Modelo I
- Page 539 and 540:
Capítulo VI: Propuesta de Modelo I
- Page 541 and 542:
Capítulo VI: Propuesta de Modelo I
- Page 543 and 544:
Capítulo VI: Propuesta de Modelo I
- Page 545 and 546:
Capítulo VI: Propuesta de Modelo I
- Page 547 and 548:
Capítulo VI: Propuesta de Modelo I
- Page 549 and 550:
Capítulo VI: Propuesta de Modelo I
- Page 551 and 552:
Capítulo VI: Propuesta de Modelo I
- Page 553 and 554:
Capítulo VI: Propuesta de Modelo I
- Page 555 and 556:
Capítulo VI: Propuesta de Modelo I
- Page 557:
Capítulo VI: Propuesta de Modelo I
- Page 560 and 561:
Conclusiones de la Parte III - El P
- Page 563 and 564:
CONCLUSIONES FINALES 565 Conclusion
- Page 565 and 566:
567 Conclusiones Finales cias, el a
- Page 567 and 568:
569 Conclusiones Finales niones los
- Page 569:
571 Conclusiones Finales - En los n
- Page 572 and 573:
Anexos Anexo 1: Inmigrantes irregul
- Page 574 and 575:
Anexos La denuncia está ya registr
- Page 576 and 577:
Anexos Anexo 4: Colectivos nacional
- Page 578 and 579:
Anexos Anexo 6: Totales de noticias
- Page 580 and 581:
Anexos Anexo 8: Ejemplo de Editoria
- Page 582 and 583:
Anexos Anexo 10: Ejemplo de noticia
- Page 584 and 585:
Anexos Anexo 12: Noticia sobre la i
- Page 586 and 587:
Anexos http://www.eacnur.org/ Agenc
- Page 588 and 589:
Anexos levisión españoles con rel
- Page 590 and 591:
Anexos http://sauce.pntic.mec.es/~s
- Page 592 and 593:
Anexos www.dur.ac.uk/~dml0mpt/ep-in
- Page 594 and 595:
Anexos Anexo 14: Lista de webs raci
- Page 596 and 597:
Anexos Anexo 16: Alumnado extranjer
- Page 598 and 599:
Anexos Anexo 18: Alumnado según na
- Page 600 and 601:
Anexos Valencia 13955 2687 6356 56
- Page 602 and 603:
Anexos DATOS PERSONALES Apellidos:
- Page 604 and 605:
Anexos IDENTIFICACIÓN DE LAS NECES
- Page 606 and 607:
Anexos 3. Suelo valorar, sin hacer
- Page 608 and 609:
Anexos 1 2 3 4 5 22.El centro escol
- Page 610 and 611:
Anexos 40.La intervención de Equip
- Page 612 and 613:
Anexos 57.En el plan de estudios se
- Page 614 and 615:
Anexos Asignaturas en valores. ¿Re
- Page 616 and 617:
Anexos Anexo 23: Respuestas de los
- Page 618 and 619:
Anexos han traído a la escuela a p
- Page 620 and 621:
Anexos R - Yo me inclinaría por es
- Page 622 and 623:
Anexos L - En mi opinión, los alum
- Page 624 and 625:
Anexos Emilio - Impactado no. Simpl
- Page 626 and 627:
Anexos A - Yo creo que en algunos a
- Page 628 and 629:
Anexos R - Tiene que afectar a la f
- Page 630 and 631:
Anexos N - De esta escuela en concr
- Page 632 and 633:
Anexos Anexo 25: Respuestas de los
- Page 634 and 635:
Anexos Alberto Hernández (3º FR)
- Page 636 and 637:
Anexos están un poco más alejados
- Page 638 and 639:
Anexos Anexo 27: Canciones / temas
- Page 640 and 641:
Anexos 1. Planteamos a los alumnos
- Page 642 and 643:
Anexos Anexo 28: Algunas películas
- Page 644 and 645:
Anexos Mientras toma un helado en u
- Page 646 and 647:
Anexos Philadelphia, de Jonathan De
- Page 648 and 649:
Anexos Anexo 30: Dinámicas intercu
- Page 650 and 651:
Anexos o Los extranjeros que yo con
- Page 652 and 653:
Anexos Anexo 31: Otros Programas y
- Page 654 and 655:
Anexos Anexo 33: Libros y manuales
- Page 656 and 657:
Anexos Una de sus versiones introdu
- Page 658 and 659:
Anexos - LA VIDA MORAL Y LA REFLEXI
- Page 660 and 661:
Anexos Títulos: Libro del alumno;
- Page 662 and 663:
Anexos ___________________________
- Page 664 and 665:
Anexos EL TELÉFONO (Mensaje secret
- Page 666 and 667:
Anexos Cada alumno utiliza una silu
- Page 668 and 669:
Anexos M5 Interculturalidad y relig
- Page 670 and 671:
Anexos Anexo 37: ONGs relacionadas
- Page 672 and 673:
Anexos ción de la Mujer Aymara', '
- Page 674 and 675:
Anexos ma d'Educacio Intercultural
- Page 676 and 677:
Anexos lleres mensuales en un espac
- Page 678 and 679:
Anexos - TRANSLIT, ASSOCIACIÓ CULT
- Page 680 and 681:
Anexos - ALMERÍA ACOGE Web de la A
- Page 682 and 683:
Anexos - CENTRO DE INVESTIGACIONES
- Page 684 and 685:
Anexos - FEDERACIÓN DE MUJERES PRO
- Page 686 and 687:
Anexos - MANOS UNIDAS http://www.ma
- Page 688 and 689:
Anexos - RASINET Red de Apoyo Socia
- Page 690 and 691:
Anexos Anexo 39: “Madrid Intercul
- Page 692 and 693:
Anexos - Salida de Madrid - Chamart
- Page 695:
Índice de Tablas 697 Índice de Ta
- Page 699 and 700:
FUENTES DE INFORMACIÓN Y DOCUMENTA
- Page 701:
703 Fuentes de Información y Docum
- Page 704 and 705:
Bibliografía Citada CARRASCO, J. B
- Page 706 and 707:
Bibliografía Citada - (2001): “M
- Page 708 and 709:
Bibliografía Citada MECD, (2003):
- Page 710 and 711:
Bibliografía Citada VARIOS, (1999)
- Page 712 and 713:
Índice General 6.4 La Inmigración
- Page 714 and 715:
Índice General 5.6 Distribución d
- Page 716 and 717:
Índice General 4 Diseño de la inv
- Page 718 and 719:
Índice General 2.3 Significación
- Page 720 and 721:
Índice General 2.8.4 Diferencias s
- Page 722 and 723:
Índice General 2.2.5 Educación In
- Page 724 and 725:
Índice General 2.11 El Practicum c