- Page 1 and 2:
www.FreeLibros.com
- Page 3 and 4:
METODOLOGÍA de la investigación w
- Page 5 and 6:
METODOLOGÍA de la investigación Q
- Page 7 and 8:
Dedicatorias A Dios; a mis adorable
- Page 9 and 10:
Contenido Agradecimientos xxi Pról
- Page 11 and 12:
Contenido ix CAPÍTULO 5 Definició
- Page 13 and 14:
Contenido xi 3. Diseño de cuatro g
- Page 15 and 16:
Contenido xiii ¿Una o varias pregu
- Page 17 and 18:
Contenido xv ¿Qué es el tamaño d
- Page 19 and 20:
Contenido xvii Partes en la entrevi
- Page 21 and 22:
Contenido xix PARTE 4 Los procesos
- Page 23 and 24:
Agradecimientos Los autores deseamo
- Page 25 and 26:
Al respecto, los autores queremos s
- Page 27 and 28:
Prólogo xxv Página web Además la
- Page 29 and 30:
Prólogo xxvii y analice las nuevas
- Page 31 and 32:
Agradecimientos especiales Los auto
- Page 33 and 34:
Agradecimientos especiales xxxi Con
- Page 35 and 36:
Agradecimientos especiales xxxiii I
- Page 37 and 38:
Agradecimientos especiales xxxv Mor
- Page 39 and 40:
Agradecimientos especiales xxxvii S
- Page 41 and 42:
Estructura pedagógica xxxix • Ej
- Page 43 and 44:
PARTE 1 Los enfoques cuantitativo y
- Page 45 and 46:
Características • Mide fenómeno
- Page 47 and 48:
¿Qué características posee el en
- Page 49 and 50:
¿Qué características posee el en
- Page 51 and 52:
¿Qué características posee el en
- Page 53 and 54:
¿Cuáles son las diferencias entre
- Page 55 and 56:
¿Cuáles son las diferencias entre
- Page 57 and 58:
¿Cuáles son las diferencias entre
- Page 59 and 60:
¿Cuál de los dos enfoques es el m
- Page 61 and 62:
¿Cuál de los dos enfoques es el m
- Page 63 and 64:
Los investigadores opinan 21 Concep
- Page 65 and 66:
Los investigadores opinan 23 tratad
- Page 67 and 68:
Proyectos de investigación inician
- Page 69 and 70:
¿Cómo se originan las investigaci
- Page 71 and 72:
¿Cómo se originan las investigaci
- Page 73 and 74:
Los investigadores opinan 31 Consec
- Page 75 and 76:
PARTE 2 El proceso de la investigac
- Page 77 and 78:
Planteamiento del problema cuantita
- Page 79 and 80:
¿Qué elementos contiene el plante
- Page 81 and 82:
¿Qué elementos contiene el plante
- Page 83 and 84:
¿Qué elementos contiene el plante
- Page 85 and 86:
¿Qué elementos contiene el plante
- Page 87 and 88:
Ejemplos desarrollados 45 vincia de
- Page 89 and 90:
Los investigadores opinan 47 Justif
- Page 91 and 92:
www.FreeLibros.com
- Page 93 and 94:
Desarrollo de la perspectiva teóri
- Page 95 and 96:
¿Qué etapas comprende el desarrol
- Page 97 and 98:
¿Qué etapas comprende el desarrol
- Page 99 and 100:
¿Qué etapas comprende el desarrol
- Page 101 and 102:
¿Qué etapas comprende el desarrol
- Page 103 and 104:
¿Qué etapas comprende el desarrol
- Page 105 and 106:
¿Qué etapas comprende el desarrol
- Page 107 and 108:
Algunas observaciones sobre el desa
- Page 109 and 110:
¿Qué método podemos seguir para
- Page 111 and 112:
¿Qué método podemos seguir para
- Page 113 and 114:
¿Se ha hecho una revisión adecuad
- Page 115 and 116:
Resumen 73 indicados), utilizando l
- Page 117 and 118:
Los investigadores opinan 75 4.2. T
- Page 119 and 120:
Exploratorios • Investigan proble
- Page 121 and 122:
¿En qué consisten los estudios de
- Page 123 and 124:
¿En qué consisten los estudios de
- Page 125 and 126:
¿En qué consisten los estudios de
- Page 127 and 128:
¿Una misma investigación puede in
- Page 129 and 130:
Conceptos básicos 87 ¿Cuál de lo
- Page 131 and 132:
Los investigadores opinan 89 de man
- Page 133 and 134:
El desarrollo de la perspectiva te
- Page 135 and 136:
¿De dónde surgen las hipótesis?
- Page 137 and 138:
¿Qué características debe tener
- Page 139 and 140:
¿Qué son las hipótesis de invest
- Page 141 and 142:
¿Qué son las hipótesis de invest
- Page 143 and 144:
¿Qué son las hipótesis de invest
- Page 145 and 146:
¿Qué son las hipótesis de invest
- Page 147 and 148:
¿Qué son las hipótesis alternati
- Page 149 and 150:
¿Qué es la prueba de hipótesis?
- Page 151 and 152:
¿Deben definirse las variables de
- Page 153 and 154:
Definiciones operacionales 111 Defi
- Page 155 and 156:
Resumen 113 Resumen • En este pun
- Page 157 and 158:
Los investigadores opinan 115 Apat
- Page 159 and 160:
www.FreeLibros.com
- Page 161 and 162:
Diseño de investigación Cuyo prop
- Page 163 and 164:
Diseños experimentales 121 En el p
- Page 165 and 166:
Diseños experimentales 123 EJEMPLO
- Page 167 and 168:
¿Cómo se define la manera de mani
- Page 169 and 170:
¿Cuántas variables independientes
- Page 171 and 172:
¿Cuál es el tercer requisito de u
- Page 173 and 174:
¿Cómo se logran el control y la v
- Page 175 and 176:
¿Cómo se logran el control y la v
- Page 177 and 178:
Una tipología sobre los diseños e
- Page 179 and 180:
Experimentos “puros” 137 Los do
- Page 181 and 182:
Experimentos “puros” 139 difere
- Page 183 and 184:
Experimentos “puros” 141 Es pos
- Page 185 and 186:
Experimentos “puros” 143 Las di
- Page 187 and 188:
¿Qué es la validez externa? 145 e
- Page 189 and 190:
Simbología de los diseños con emp
- Page 191 and 192:
Diseños no experimentales 149 Paso
- Page 193 and 194:
¿Cuáles son los tipos de diseños
- Page 195 and 196:
Diseños transeccionales descriptiv
- Page 197 and 198:
Diseños transeccionales descriptiv
- Page 199 and 200:
Diseños transeccionales descriptiv
- Page 201 and 202:
Diseños transeccionales descriptiv
- Page 203 and 204:
Diseños transeccionales descriptiv
- Page 205 and 206:
¿Cuáles son las características
- Page 207 and 208:
Resumen 165 • Los experimentos qu
- Page 209 and 210:
Ejercicios 167 ejemplo: género, ed
- Page 211 and 212:
Los investigadores opinan 169 Los i
- Page 213 and 214:
Muestra (es un subgrupo de la pobla
- Page 215 and 216:
Lo primero: ¿sobre qué o quiénes
- Page 217 and 218:
¿Cómo seleccionar la muestra? 175
- Page 219 and 220:
¿Cómo se selecciona una muestra p
- Page 221 and 222:
¿Cómo se selecciona una muestra p
- Page 223 and 224:
¿Cómo se selecciona una muestra p
- Page 225 and 226:
¿Cómo se lleva a cabo el procedim
- Page 227 and 228:
Listados y otros marcos muestrales
- Page 229 and 230:
Tamaño óptimo de una muestra 187
- Page 231 and 232:
¿Cómo y cuáles son las muestras
- Page 233 and 234:
Conceptos básicos 191 Resumen •
- Page 235 and 236:
Ejemplos desarrollados 193 sería m
- Page 237 and 238:
Los investigadores opinan 195 Por
- Page 239 and 240:
Fases de construcción de un instru
- Page 241 and 242:
¿Qué significa medir? 199 Plantea
- Page 243 and 244:
¿Qué requisitos debe cubrir un in
- Page 245 and 246:
¿Qué requisitos debe cubrir un in
- Page 247 and 248:
¿Qué requisitos debe cubrir un in
- Page 249 and 250:
¿Cómo se sabe si un instrumento d
- Page 251 and 252:
¿Qué procedimiento se sigue para
- Page 253 and 254:
Tres cuestiones fundamentales para
- Page 255 and 256:
Tres cuestiones fundamentales para
- Page 257 and 258:
Tres cuestiones fundamentales para
- Page 259 and 260:
¿De qué tipos de instrumentos de
- Page 261 and 262:
¿De qué tipos de instrumentos de
- Page 263 and 264:
¿De qué tipos de instrumentos de
- Page 265 and 266:
¿De qué tipos de instrumentos de
- Page 267 and 268:
¿De qué tipos de instrumentos de
- Page 269 and 270:
¿De qué tipos de instrumentos de
- Page 271 and 272:
¿De qué tipos de instrumentos de
- Page 273 and 274:
¿De qué tipos de instrumentos de
- Page 275 and 276:
¿De qué tipos de instrumentos de
- Page 277 and 278:
¿De qué tipos de instrumentos de
- Page 279 and 280:
¿De qué tipos de instrumentos de
- Page 281 and 282:
¿De qué tipos de instrumentos de
- Page 283 and 284:
¿De qué tipos de instrumentos de
- Page 285 and 286:
¿De qué tipos de instrumentos de
- Page 287 and 288:
Escalas para medir las actitudes 24
- Page 289 and 290:
Escalas para medir las actitudes 24
- Page 291 and 292:
Escalas para medir las actitudes 24
- Page 293 and 294:
Escalas para medir las actitudes 25
- Page 295 and 296:
Escalas para medir las actitudes 25
- Page 297 and 298:
Escalas para medir las actitudes 25
- Page 299 and 300:
Escalas para medir las actitudes 25
- Page 301 and 302: Escalas para medir las actitudes 25
- Page 303 and 304: Otros métodos cuantitativos de rec
- Page 305 and 306: ¿Cómo se codifican las respuestas
- Page 307 and 308: ¿Cómo se codifican las respuestas
- Page 309 and 310: ¿Cómo se codifican las respuestas
- Page 311 and 312: ¿Cómo se codifican las respuestas
- Page 313 and 314: Conceptos básicos 271 Tabla 9.11 C
- Page 315 and 316: Ejemplos desarrollados 273 fueran c
- Page 317 and 318: Los investigadores opinan 275 da el
- Page 319 and 320: Se realiza mediante programas compu
- Page 321 and 322: Paso 1: seleccionar un programa de
- Page 323 and 324: Paso 1: seleccionar un programa de
- Page 325 and 326: Paso 3: explorar los datos 283 cons
- Page 327 and 328: Paso 3: explorar los datos 285 ros:
- Page 329 and 330: Estadística descriptiva para cada
- Page 331 and 332: Estadística descriptiva para cada
- Page 333 and 334: Estadística descriptiva para cada
- Page 335 and 336: Estadística descriptiva para cada
- Page 337 and 338: Estadística descriptiva para cada
- Page 339 and 340: Estadística descriptiva para cada
- Page 341 and 342: Estadística descriptiva para cada
- Page 343 and 344: Paso 4: evaluar la confiabilidad o
- Page 345 and 346: Paso 4: evaluar la confiabilidad o
- Page 347 and 348: Paso 5: analizar mediante pruebas e
- Page 349 and 350: Paso 5: analizar mediante pruebas e
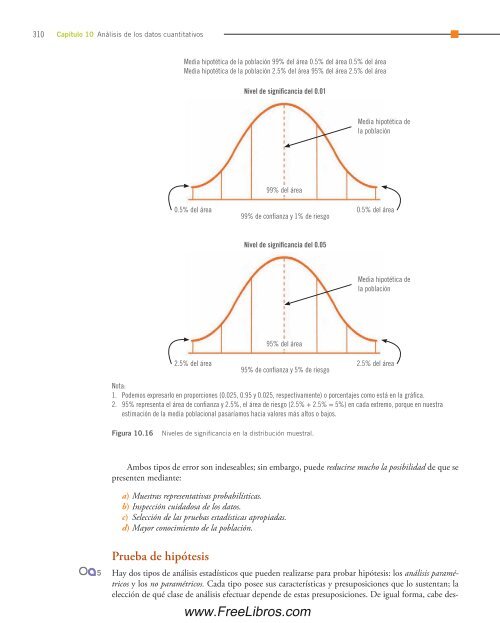
- Page 351: Paso 5: analizar mediante pruebas e
- Page 355 and 356: Análisis paramétricos 313 Observe
- Page 357 and 358: Análisis paramétricos 315 El diag
- Page 359 and 360: Análisis paramétricos 317 Así, c
- Page 361 and 362: Análisis paramétricos 319 En la p
- Page 363 and 364: Análisis paramétricos 321 Tabla 1
- Page 365 and 366: Análisis paramétricos 323 Hipóte
- Page 367 and 368: Estadística multivariada 325 Comen
- Page 369 and 370: Análisis no paramétricos 327 ¿Cu
- Page 371 and 372: Análisis no paramétricos 329 El c
- Page 373 and 374: Otros coeficientes de correlación
- Page 375 and 376: Otros coeficientes de correlación
- Page 377 and 378: Paso 7: preparar los resultados par
- Page 379 and 380: Conceptos básicos 337 • Los aná
- Page 381 and 382: Ejemplos desarrollados 339 7. Desar
- Page 383 and 384: Ejemplos desarrollados 341 Piensa e
- Page 385 and 386: Los investigadores opinan 343 Tabla
- Page 387 and 388: www.FreeLibros.com
- Page 389 and 390: El tipo de reporte a elaborar Se de
- Page 391 and 392: Antes de elaborar el reporte de inv
- Page 393 and 394: Antes de elaborar el reporte de inv
- Page 395 and 396: Antes de elaborar el reporte de inv
- Page 397 and 398: Antes de elaborar el reporte de inv
- Page 399 and 400: Ejemplos desarrollados 357 Ejemplos
- Page 401 and 402: Los investigadores opinan 359 que e
- Page 403 and 404:
PARTE 3 El proceso de la investigac
- Page 405 and 406:
Debe considerar: • Objetivos •
- Page 407 and 408:
¿Qué significa plantear el proble
- Page 409 and 410:
¿Qué significa plantear el proble
- Page 411 and 412:
¿Qué papel desempeñan la revisi
- Page 413 and 414:
Una vez hecho el planteamiento inic
- Page 415 and 416:
Una vez hecho el planteamiento inic
- Page 417 and 418:
Ingresamos al ambiente o campo, ¿y
- Page 419 and 420:
Ingresamos al ambiente o campo, ¿y
- Page 421 and 422:
Ingresamos al ambiente o campo, ¿y
- Page 423 and 424:
Ingresamos al ambiente o campo, ¿y
- Page 425 and 426:
Ingresamos al ambiente o campo, ¿y
- Page 427 and 428:
Ejemplos desarrollados 385 Concepto
- Page 429 and 430:
Ejemplos desarrollados 387 I. Objet
- Page 431 and 432:
Los investigadores opinan 389 III.
- Page 433 and 434:
www.FreeLibros.com
- Page 435 and 436:
Muestreo en la investigación cuali
- Page 437 and 438:
Después de la inmersión inicial:
- Page 439 and 440:
Después de la inmersión inicial:
- Page 441 and 442:
Después de la inmersión inicial:
- Page 443 and 444:
Después de la inmersión inicial:
- Page 445 and 446:
Ejemplos desarrollados 403 3. Una i
- Page 447 and 448:
www.FreeLibros.com
- Page 449 and 450:
Recolección y análisis de datos e
- Page 451 and 452:
La recolección de los datos desde
- Page 453 and 454:
Observación 411 fundamentos o expe
- Page 455 and 456:
Observación 413 Así, seleccionamo
- Page 457 and 458:
Observación 415 Después de la inm
- Page 459 and 460:
Observación 417 Nivel socioeconóm
- Page 461 and 462:
Entrevistas 419 la investigación d
- Page 463 and 464:
Entrevistas 421 monio?, ¿considera
- Page 465 and 466:
Entrevistas 423 13. ¿Sus compañer
- Page 467 and 468:
Sesiones en profundidad o grupos de
- Page 469 and 470:
Sesiones en profundidad o grupos de
- Page 471 and 472:
Sesiones en profundidad o grupos de
- Page 473 and 474:
Sesiones en profundidad o grupos de
- Page 475 and 476:
Documentos, registros, materiales y
- Page 477 and 478:
Documentos, registros, materiales y
- Page 479 and 480:
Biografías e historias de vida 437
- Page 481 and 482:
El análisis de los datos cualitati
- Page 483 and 484:
El análisis de los datos cualitati
- Page 485 and 486:
El análisis de los datos cualitati
- Page 487 and 488:
El análisis de los datos cualitati
- Page 489 and 490:
El análisis de los datos cualitati
- Page 491 and 492:
El análisis de los datos cualitati
- Page 493 and 494:
El análisis de los datos cualitati
- Page 495 and 496:
El análisis de los datos cualitati
- Page 497 and 498:
El análisis de los datos cualitati
- Page 499 and 500:
El análisis de los datos cualitati
- Page 501 and 502:
El análisis de los datos cualitati
- Page 503 and 504:
El análisis de los datos cualitati
- Page 505 and 506:
El análisis de los datos cualitati
- Page 507 and 508:
El análisis de los datos cualitati
- Page 509 and 510:
El análisis de los datos cualitati
- Page 511 and 512:
El análisis de los datos cualitati
- Page 513 and 514:
Rigor en la investigación cualitat
- Page 515 and 516:
Rigor en la investigación cualitat
- Page 517 and 518:
Rigor en la investigación cualitat
- Page 519 and 520:
Rigor en la investigación cualitat
- Page 521 and 522:
Resumen 479 En el CD anexo: Materia
- Page 523 and 524:
Conceptos básicos 481 • Durante
- Page 525 and 526:
Ejercicios 483 CONVERTIR UN ARCHIVO
- Page 527 and 528:
Ejemplos desarrollados 485 También
- Page 529 and 530:
Los investigadores opinan 487 • I
- Page 531 and 532:
www.FreeLibros.com
- Page 533 and 534:
Teoría fundamentada Diseños que p
- Page 535 and 536:
Diseños de teoría fundamentada 49
- Page 537 and 538:
Diseños de teoría fundamentada 49
- Page 539 and 540:
Diseños de teoría fundamentada 49
- Page 541 and 542:
Diseños de teoría fundamentada 49
- Page 543 and 544:
Diseños etnográficos 501 La teor
- Page 545 and 546:
Diseños etnográficos 503 3. Dise
- Page 547 and 548:
Diseños narrativos 505 Delimitaci
- Page 549 and 550:
Diseños narrativos 507 Asimismo, a
- Page 551 and 552:
Diseños de investigación-acción
- Page 553 and 554:
Diseños de investigación-acción
- Page 555 and 556:
Diseños de investigación-acción
- Page 557 and 558:
Otros diseños 515 El diseño de in
- Page 559 and 560:
Ejercicios 517 • En los diseños
- Page 561 and 562:
Ejemplos desarrollados 519 hechos r
- Page 563 and 564:
www.FreeLibros.com
- Page 565 and 566:
Sus elementos son: • Descripción
- Page 567 and 568:
Estructura del reporte cualitativo
- Page 569 and 570:
Estructura del reporte cualitativo
- Page 571 and 572:
Estructura del reporte cualitativo
- Page 573 and 574:
Estructura del reporte cualitativo
- Page 575 and 576:
Estructura del reporte cualitativo
- Page 577 and 578:
Estructura del reporte cualitativo
- Page 579 and 580:
El reporte del diseño de investiga
- Page 581 and 582:
Ejemplos desarrollados 539 • De s
- Page 583 and 584:
Ejemplos desarrollados 541 personal
- Page 585 and 586:
PARTE 4 Los procesos mixtos de inve
- Page 587 and 588:
Implican: • Recolección • Aná
- Page 589 and 590:
Los métodos mixtos: ¿el fin de la
- Page 591 and 592:
¿Por qué utilizar los métodos mi
- Page 593 and 594:
¿Cuál es el sustento filosófico
- Page 595 and 596:
El proceso mixto 553 perspectivas,
- Page 597 and 598:
El proceso mixto 555 ¿qué bebidas
- Page 599 and 600:
El proceso mixto 557 Experiencias d
- Page 601 and 602:
El proceso mixto 559 los datos, as
- Page 603 and 604:
El proceso mixto 561 Enfoque o mét
- Page 605 and 606:
Diseños mixtos específicos 563 En
- Page 607 and 608:
Diseños mixtos específicos 565 Ej
- Page 609 and 610:
Diseños mixtos específicos 567 EJ
- Page 611 and 612:
Diseños mixtos específicos 569 za
- Page 613 and 614:
Diseños mixtos específicos 571 so
- Page 615 and 616:
Diseños mixtos específicos 573 Pa
- Page 617 and 618:
Diseños mixtos específicos 575 La
- Page 619 and 620:
Diseños mixtos específicos 577 to
- Page 621 and 622:
Diseños mixtos específicos 579 ga
- Page 623 and 624:
Muestreo 581 3. Muestreo concurrent
- Page 625 and 626:
Recolección de los datos 583 Por e
- Page 627 and 628:
Recolección de los datos 585 bleci
- Page 629 and 630:
Análisis de los datos 587 Tabla 17
- Page 631 and 632:
Resultados e inferencias 589 En el
- Page 633 and 634:
Retos de los diseños mixtos 591 Ta
- Page 635 and 636:
Resumen 593 desarrollar variables y
- Page 637 and 638:
Ejercicios 595 Diseño de integraci
- Page 639 and 640:
Ejemplos desarrollados 597 Tales re
- Page 641 and 642:
Los investigadores opinan 599 100.0
- Page 643 and 644:
Los investigadores opinan 601 Los m
- Page 645 and 646:
Índice onomástico A Achyat, 251 A
- Page 647 and 648:
Índice onomástico 605 Lew, Allen,
- Page 649 and 650:
Índice analítico A Actitud(es), 2
- Page 651 and 652:
Índice analítico 609 medidas de t
- Page 653 and 654:
Índice analítico 611 evaluación
- Page 655 and 656:
Índice analítico 613 U Unidades d