- Page 1 and 2: La empleabilidad de los jóvenes en
- Page 3 and 4: 8 Enseñanzas de idiomas ..........
- Page 5 and 6: 2 1.3.7 Régimen disciplinario. ...
- Page 7 and 8: 5 Medidas estatales de fomento del
- Page 9 and 10: Parte I.‐ El mercado de trabajo d
- Page 11 and 12: disminución de población joven no
- Page 13 and 14: Gráfico 1.4.- Distribución de la
- Page 15 and 16: 1.2.- Población activa En diciembr
- Page 17 and 18: Gráfico 1.9.- Distribución de la
- Page 19 and 20: población total y de la población
- Page 21 and 22: Gráfico 1.15.- Tasa de Actividad j
- Page 23 and 24: Gráfico 1.18.- Tasas de Actividad
- Page 25 and 26: Si analizamos las tasas de activida
- Page 27 and 28: la población total una merma del 3
- Page 29 and 30: Gráfico 1.26.- Población Ocupada
- Page 31 and 32: Gráfico 1.29.- Distribución de la
- Page 33 and 34: provincias vieron descender su pobl
- Page 35 and 36: Soria 1.4.- Población asalariada F
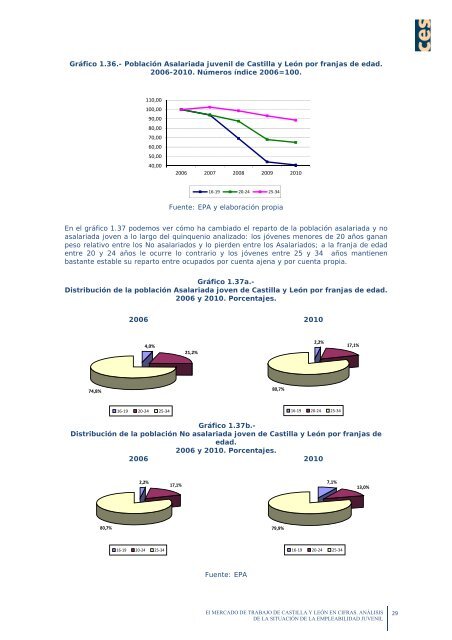
- Page 37: En el mismo orden de cosas, pero de
- Page 41 and 42: Miles de personas Miles de personas
- Page 43 and 44: En el cuadro 1.14 podemos observar
- Page 45 and 46: Gráfico 1.43.- Población Parada j
- Page 47 and 48: situación personal de los desemple
- Page 49 and 50: Como es fácil de apreciar, el incr
- Page 51 and 52: Análisis según el Tiempo de inscr
- Page 53 and 54: Gráfico 1.55.- Población Parada j
- Page 55 and 56: Población activa Hemos dicho que l
- Page 57 and 58: Como consecuencia, la importancia r
- Page 59 and 60: Gráfico 1.63.- Distribución de la
- Page 61 and 62: Gráfico 1.66.- Distribución de la
- Page 63 and 64: Cuadro 1.22.- Población Ocupada jo
- Page 65 and 66: De los que llegaron a la primera et
- Page 67 and 68: Gráfico 2.1.- Tasa de Actividad ju
- Page 69 and 70: del empleo juvenil español se haya
- Page 71 and 72: Tendencia mundial Figura 2.1.- Tasa
- Page 73 and 74: 2.2.- Recomendaciones internacional
- Page 75 and 76: Gráfico 1.11 Bis.- Tasas de Activi
- Page 77 and 78: Gráfico 1.26 Bis.- Evolución de l
- Page 79 and 80: Gráfico 51 Bis.- Tasa de Paro juve
- Page 81 and 82: Parte II.‐ LA FORMACIÓN COMO MEC
- Page 83 and 84: Sea como fuere, se constata como de
- Page 85 and 86: e) Un desempeño competente en la b
- Page 87 and 88: Desde el punto de vista empresarial
- Page 89 and 90:
En el afán por superar estas lacra
- Page 91 and 92:
3.- Las tasas de escolarización en
- Page 93 and 94:
integración de los alumnos y alumn
- Page 95 and 96:
8.- Atención individualizada a cad
- Page 97 and 98:
La estructuración en áreas “no
- Page 99 and 100:
decidir, desde el momento en que aq
- Page 101 and 102:
1) Los centros educativos podrán o
- Page 103 and 104:
Autonomías situadas entre un 25 y
- Page 105 and 106:
Artes; el 38,1%, la de Ciencias de
- Page 107 and 108:
4.- Formación Profesional “La fo
- Page 109 and 110:
En fin, “para poner claridad en e
- Page 111 and 112:
estrecho vínculo se detecta igualm
- Page 113 and 114:
constata la Estrategia española de
- Page 115 and 116:
cualificaciones profesionales de ni
- Page 117 and 118:
competencias profesionales necesari
- Page 119 and 120:
En el momento actual, si de optimiz
- Page 121 and 122:
de referencia”, teniendo en cuent
- Page 123 and 124:
En cuarto término, módulo de form
- Page 125 and 126:
GRADO TÍTULO OFERTA CASTILLA Y LE
- Page 127 and 128:
SUPERIOR Audiología Protésica Dec
- Page 129 and 130:
conduce a desestimar esta enseñanz
- Page 131 and 132:
4.2.3.- Cursos de especialización
- Page 133 and 134:
de un tratado internacional ni se c
- Page 135 and 136:
investigación al servicio de la co
- Page 137 and 138:
superior” 205 ; RD 1125/2003, de
- Page 139 and 140:
especialización académica o profe
- Page 141 and 142:
DIRECCIÓN DE EMPRESAS GRADO EN CIE
- Page 143 and 144:
PRIMARIA GRADO EN EDUCACIÓN SOCIAL
- Page 145 and 146:
GEOLÓGICA GRADO EN INGENIERÍA GEO
- Page 147 and 148:
GRADO EN EDUCACIÓN PRIMARIA (SORIA
- Page 149 and 150:
LABORALES Y RECURSOS HUMANOS (PALEN
- Page 151 and 152:
GRADO EN ENFERMERÍA GRADO EN INGEN
- Page 153 and 154:
enseñanzas de arte dramático 223
- Page 155 and 156:
3) 231 . En todo caso, los alumnos
- Page 157 and 158:
título: el de obra final tiene por
- Page 159 and 160:
universitarios, ex disposición adi
- Page 161 and 162:
632/2010, gemelo, en lo básico, de
- Page 163 and 164:
4.- La distribución de los crédit
- Page 165 and 166:
“desde el punto de vista estraté
- Page 167 and 168:
de 13 de febrero), balonmano (RD 36
- Page 169 and 170:
especialidad correspondiente, que p
- Page 171 and 172:
el japonés (art. 3 RD 1629/2006).
- Page 173 and 174:
prácticas en empresas, incentivos
- Page 175 and 176:
autorizadas por la representación
- Page 177 and 178:
El nuevo planteamiento asume como t
- Page 179 and 180:
j) Implementar medidas que facilite
- Page 181 and 182:
superación de tales programas “c
- Page 183 and 184:
contexto en el que actúan”, suel
- Page 185 and 186:
indicador de calidad, al garantizar
- Page 187 and 188:
Al haber sido celebrado al amparo d
- Page 189 and 190:
En el reverso de la moneda, y sigui
- Page 191 and 192:
existe una competencia subvencional
- Page 193 and 194:
pretende promover la contratación
- Page 195 and 196:
E.- Fomentar los permisos individua
- Page 197 and 198:
determinada titulación del sistema
- Page 199 and 200:
compatibilizar la mayor competitivi
- Page 201 and 202:
competitividad de las mismas median
- Page 203 and 204:
puesto de trabajo o categoría o bi
- Page 205 and 206:
superior jerárquico acordará con
- Page 207 and 208:
dichos alumnos para actividad labor
- Page 209 and 210:
dimensiones personales, culturales,
- Page 211 and 212:
que no les permita acudir a los cen
- Page 213 and 214:
El aumento del papel otorgado a las
- Page 215 and 216:
formativos, mejorar sus competencia
- Page 217 and 218:
deseen presentarse a la citada prue
- Page 219 and 220:
V. Bibliografía AA.VV.: Educación
- Page 221 and 222:
BOWLES, G. y GINTIS, H.: “La educ
- Page 223 and 224:
GALINDO AYUDA, F.: “El aprendizaj
- Page 225 and 226:
LÓPEZ VERDUGO, I.; RIAO RAMÍREZ,
- Page 227 and 228:
Plan de Formación Profesional 2011
- Page 229 and 230:
Parte III.‐ LA GESTIÓN DE LA COL
- Page 231 and 232:
sector de la población aquí anali
- Page 233 and 234:
normativa difícil de manejar en ar
- Page 235 and 236:
creación directa de empleo en el s
- Page 237 and 238:
desarrollar únicamente competencia
- Page 239 and 240:
medidas que afecten a los jóvenes
- Page 241 and 242:
ámbito del trabajo y el empleo, lo
- Page 243 and 244:
potestades finales del Estado, aun
- Page 245 and 246:
acompañamiento, que se desvinculan
- Page 247 and 248:
c) Potenciar la igualdad entre muje
- Page 249 and 250:
orientaciones y objetivos de la est
- Page 251 and 252:
asesoramiento a un número crecient
- Page 253 and 254:
Colaboradores o Asociados”. Tan c
- Page 255 and 256:
Pese a que la intención del legisl
- Page 257 and 258:
es lógico pensar que los datos con
- Page 259 and 260:
acciones de fomento del empleo. Est
- Page 261 and 262:
y reintegrará con ese dinero a la
- Page 263 and 264:
oficial, validez en todo el territo
- Page 265 and 266:
Es más -y en esta línea aperturis
- Page 267 and 268:
interesado y la comprobación de la
- Page 269 and 270:
a) La elaboración y gestión de la
- Page 271 and 272:
c) Gerencias Provinciales, dentro d
- Page 273 and 274:
proveedores de servicios, implement
- Page 275 and 276:
Inmigración, se aprueban las dispo
- Page 277 and 278:
hasta entonces, lo que llevó a gir
- Page 279 and 280:
hubiera podido ocasionar muy serias
- Page 281 and 282:
No obstante, y a pesar de las difí
- Page 283 and 284:
1129/2008, de 4 de julio), cuya com
- Page 285 and 286:
instrumento estratégico de importa
- Page 287 and 288:
subvenciones al objeto aquí analiz
- Page 289 and 290:
Nacionales de Acción para el emple
- Page 291 and 292:
Comunidades Autónomas. Esto era as
- Page 293 and 294:
comprobar la coincidencia general d
- Page 295 and 296:
Europea de Coordinación, cuya misi
- Page 297 and 298:
por la Administración competente o
- Page 299 and 300:
desarrollo de sus funciones 301 . P
- Page 301 and 302:
adicional 4ª Ley 27/2009, de 30 de
- Page 303 and 304:
subsidios por desempleo, sino tambi
- Page 305 and 306:
social de las empresas” 346 , que
- Page 307 and 308:
Autónoma de Castilla y León, prop
- Page 309 and 310:
las agencias de colocación y las E
- Page 311 and 312:
Estratégico para la Economía Espa
- Page 313 and 314:
exigible para el registro, depósit
- Page 315 and 316:
previsión venía a dejar claras tr
- Page 317 and 318:
cubrir una determinada vacante que
- Page 319 and 320:
En cambio, cuando quien gestiona la
- Page 321 and 322:
vano el ejercicio del "derecho de r
- Page 323 and 324:
cabe duda que ello atañe también
- Page 325 and 326:
de las organizaciones sindicales y
- Page 327 and 328:
XIII.- Bibliografía ALAMEDA CASTIL
- Page 329 and 330:
laboral 2010, GARCÍA-PERROTE ESCAR
- Page 331 and 332:
ELORDI DENTICI, A.; DEL REY GUANTER
- Page 333 and 334:
GARCÍA MARCO, F.A.: “Administrac
- Page 335 and 336:
LEGUIDEC, R.: “Decadencia y resur
- Page 337 and 338:
MOLINA GARCÍA, M., El contrato de
- Page 339 and 340:
NARTÍNEZ LUCAS, J.A.: Infracciones
- Page 341 and 342:
QUINTANA LÓPEZ, T.: “La activida
- Page 343 and 344:
ROJO TORRECILLA, M., “Servicios P
- Page 345 and 346:
SERRANO FALCÓN, C.: “Más allá
- Page 347 and 348:
PÉREZ, J.L.; MORENO VIDA, M.N. y F
- Page 349 and 350:
Capítulo I. Contrato de trabajo en
- Page 351 and 352:
perfeccionamiento profesional 6 (o
- Page 353 and 354:
que sólo lo sería de conseguir ac
- Page 355 and 356:
supuesto de que el trabajador no ha
- Page 357 and 358:
condicionantes mínimos de proporci
- Page 359 and 360:
2.1.- La ausencia de cualificación
- Page 361 and 362:
3.1.- La cualificación para el pue
- Page 363 and 364:
convencional (lo cual no es nada fr
- Page 365 and 366:
A.- El tutor --sea un trabajador o
- Page 367 and 368:
5.- Condiciones de trabajo En el r
- Page 369 and 370:
profesional 140 ) y, respetando tal
- Page 371 and 372:
La exposición de estas figuras req
- Page 373 and 374:
transitando hacia el Profesor Ayuda
- Page 375 and 376:
especialmente en estos estadios ini
- Page 377 and 378:
adscrita la plaza, garantizando la
- Page 379 and 380:
A diferencia de cuanto ocurre en ot
- Page 381 and 382:
i) Por lactancia de un hijo menor d
- Page 383 and 384:
La segunda por agrupación familiar
- Page 385 and 386:
naturaleza y el periodo de prestaci
- Page 387 and 388:
2.- Los contratos laborales de apli
- Page 389 and 390:
definido en la LOU, entre cuyas fun
- Page 391 and 392:
j) Utilizar la denominación de las
- Page 393 and 394:
actividades de investigación de ca
- Page 395 and 396:
Las evaluaciones para la obtención
- Page 397 and 398:
coordinación del legislador en nor
- Page 399 and 400:
estadio de quienes aspiran a dedica
- Page 401 and 402:
e) Evaluación de la actividad. El
- Page 403 and 404:
V. Bibliografía AA.VV. (BORRAJO DA
- Page 405 and 406:
GARCÍA FORNÍA, A. M.: “El contr
- Page 407 and 408:
Capítulo II.- Otras modalidades de
- Page 409 and 410:
INTERINIDAD 31.409 165.689 181.111
- Page 411 and 412:
procede citar los siguientes 231 :
- Page 413 and 414:
2.- Aunque en el momento actual las
- Page 415 and 416:
profesional de las personas trabaja
- Page 417 and 418:
pornográficas… o cualesquiera ot
- Page 419 and 420:
atender como conviene el bien jurí
- Page 421 and 422:
1/1996, que no sólo reconoce al me
- Page 423 and 424:
1.3.2.- Medidas especiales para la
- Page 425 and 426:
1.4.- Responsabilidad administrativ
- Page 427 and 428:
1º.- “En aquellos casos, en los
- Page 429 and 430:
para situarlo entre 6 y 12 meses po
- Page 431 and 432:
Fuente: Comisión Europea, Status R
- Page 433 and 434:
información; en este caso serían
- Page 435 and 436:
la circulación diaria de un númer
- Page 437 and 438:
Si un término define la vigente si
- Page 439 and 440:
A falta de tal régimen jurídico s
- Page 441 and 442:
software o, muy a menudo, del domin
- Page 443 and 444:
Número de jóvenes ocupados en act
- Page 445 and 446:
de desempeño a través de los deno
- Page 447 and 448:
la situación descrita, los tribuna
- Page 449 and 450:
empresa y, consiguientemente, la fi
- Page 451 and 452:
del inicio y en la del cese de la a
- Page 453 and 454:
4ª.- El partícipe en este program
- Page 455 and 456:
ALONSO OLEA, M. y CASAS BAAMONDE, M
- Page 457 and 458:
MARTÍN VALVERDE, A.: Derecho del T
- Page 459 and 460:
VALDÉS DAL-RÉ, F. y LAHERA FORTEZ
- Page 461 and 462:
no cabe duda que las Comunidades Au
- Page 463 and 464:
El compromiso enunciado en el art.
- Page 465 and 466:
neutralidad, evitando patronazgos p
- Page 467 and 468:
Al tiempo, y de nuevo perjudicando
- Page 469 and 470:
En concreto, por Orden ADM 835/2009
- Page 471 and 472:
con las condiciones de igualdad que
- Page 473 and 474:
funcionarios interinos, lo cual se
- Page 475 and 476:
ámbito de la facultad judicial rev
- Page 477 and 478:
acreditados por los aspirantes, con
- Page 479 and 480:
La pretendida celeridad, sin perjui
- Page 481 and 482:
económicos que permitan la subsist
- Page 483 and 484:
concurran a las pruebas selectivas
- Page 485 and 486:
Las adaptaciones y ajustes de tiemp
- Page 487 and 488:
1.- Nacionalidad española La exige
- Page 489 and 490:
Siguiendo la recomendación de la C
- Page 491 and 492:
3.- Edad Aun cuando el art. 46.1 b)
- Page 493 and 494:
4.- No haber sido separado discipli
- Page 495 and 496:
correspondiente, no será válida l
- Page 497 and 498:
Constituyen, pues, un mecanismo de
- Page 499 and 500:
VIII.- BIBLIOGRAFÍA AGRA VIFORCOS,
- Page 501 and 502:
MARTIN PUEBLA, E.: "Trabajadores al
- Page 503 and 504:
Parte V.‐FOMENTO DEL EMPLEO, AUTO
- Page 505 and 506:
duda, causa de un mayor nivel de in
- Page 507 and 508:
abril de 1998, pues a tenor de la d
- Page 509 and 510:
del subsidio, bien contratándolos
- Page 511 and 512:
nuevas medidas de austeridad en el
- Page 513 and 514:
calificando con este carácter, por
- Page 515 and 516:
generación de nuevos puestos no se
- Page 517 and 518:
Para fomentar el empleo de calidad
- Page 519 and 520:
paso del tiempo, tanto la posible a
- Page 521 and 522:
En este sentido, los beneficios de
- Page 523 and 524:
acompañamiento a las personas empr
- Page 525 and 526:
incentivos económicos indirectos c
- Page 527 and 528:
6.2.- Programa de recualificación
- Page 529 and 530:
presupuestos del Servicio Público
- Page 531 and 532:
autónomas alcance el 40 % (OO 5-3.
- Page 533 and 534:
empleo de personas con discapacidad
- Page 535 and 536:
menores de 30 años con una bonific
- Page 537 and 538:
establecimiento de diferentes cauce
- Page 539 and 540:
9.- Régimen específico de Castill
- Page 541 and 542:
El fomento del empleo se constituye
- Page 543 and 544:
€ en el resto. En todo caso, ser
- Page 545 and 546:
a) Haber iniciado y extinguido por
- Page 547 and 548:
favoreciendo la demanda, mediante e
- Page 549 and 550:
necesidades del tejido productivo,
- Page 551 and 552:
cambios económicos y sociales y, e
- Page 553 and 554:
experiencias positivas desarrollada
- Page 555 and 556:
) La transferencia de conocimiento
- Page 557 and 558:
actuación: atraer a un mayor núme
- Page 559 and 560:
El Espacio Europeo de Educación Su
- Page 561 and 562:
lo tanto, no se conforma ya sólo s
- Page 563 and 564:
que atiendan no sólo a la puesta e
- Page 565 and 566:
sean los trabajadores autónomos ya
- Page 567 and 568:
) Quienes en función de otra activ
- Page 569 and 570:
fue derogada por las OOMM de 16 de
- Page 571 and 572:
5.1.2.- Subvención dineraria de es
- Page 573 and 574:
Por lo que se refiere a los présta
- Page 575 and 576:
únicamente en todo aquello en lo q
- Page 577 and 578:
incompatibles con el espíritu y fi
- Page 579 and 580:
En fin, la percepción de la presta
- Page 581 and 582:
Pero tan importante como garantizar
- Page 583 and 584:
Para ello se parte de los programas
- Page 585 and 586:
III.- Elementos de contexto en la p
- Page 587 and 588:
Igualmente, la introducción de la
- Page 589 and 590:
definitivo sentado en la STCo 2/199
- Page 591 and 592:
ascendientes y demás parientes del
- Page 593 and 594:
Y como asimilados a ellos, igualmen
- Page 595 and 596:
a) Personas con parálisis cerebral
- Page 597 and 598:
u otro Régimen, sin comprobar si e
- Page 599 and 600:
actividad, equiparándose (a juicio
- Page 601 and 602:
entendiendo que no se rompe la pres
- Page 603 and 604:
debidamente retribuida” 387 salvo
- Page 605 and 606:
IV.- Bibliografía AA.VV. (ALARIO T
- Page 607 and 608:
- El régimen especial de trabajado
- Page 609 and 610:
AA.VV.: La duración del contrato d
- Page 611 and 612:
1981. - “Aspectos sociales del Tr
- Page 613 and 614:
(Aranzadi), 2004. LÓPEZ ANIORTE, M
- Page 615 and 616:
- “Concepto de políticas activas
- Page 617 and 618:
contratación laboral y de las pens
- Page 619 and 620:
VELASCO PORTERO, Mª.T. y FRÖHLICH
- Page 621 and 622:
introduce en el acervo comunitario
- Page 623 and 624:
situación de Dependencia y fomenta
- Page 625 and 626:
-- Impulsar medidas y estrategias i
- Page 627 and 628:
-- Son instrumentales. No son un fi
- Page 629 and 630:
evertirlos en mejorar el cumplimien
- Page 631 and 632:
En la misma línea de servicios, el
- Page 633 and 634:
asumen la competencia, pero el prob
- Page 635 and 636:
compromisos legales, siempre y cuan
- Page 637 and 638:
La segunda exigencia --estar inscri
- Page 639 and 640:
La división de competencias entre
- Page 641 and 642:
de trabajo, convirtiéndose entonce
- Page 643 and 644:
En fin, la Ley 44/2007 veta la apli
- Page 645 and 646:
defecto de éste, procederá aplica
- Page 647 and 648:
Los distintos estudios demuestran q
- Page 649 and 650:
políticas y legislativas que regul
- Page 651 and 652:
y solidaridad de los trabajadores,
- Page 653 and 654:
gremios, de significación profesio
- Page 655 and 656:
27/1999). En Castilla y León se re
- Page 657 and 658:
Sin embargo, en aras a no diluir el
- Page 659 and 660:
PALENCIA 124 4 12 23 85 SALAMANCA 2
- Page 661 and 662:
cooperativa, a cuyos socios trabaja
- Page 663 and 664:
4.- Centros especiales de empleo De
- Page 665 and 666:
social. Para ello, se plantea como
- Page 667 and 668:
Provincia Centros especiales de Nú
- Page 669 and 670:
Una vez elegida la persona adecuada
- Page 671 and 672:
transcurrir el tiempo necesario a l
- Page 673 and 674:
trabajador discapacitado 555 y susc
- Page 675 and 676:
-- Permitir a los trabajadores con
- Page 677 and 678:
colaborar para mejorar las capacida
- Page 679 and 680:
El art. 2 Ley 50/2002 define las fu
- Page 681 and 682:
sociolaborales de los empresarios e
- Page 683 and 684:
II.- El Voluntariado en Castilla y
- Page 685 and 686:
Fuente: Memoria de Voluntariado 200
- Page 687 and 688:
La norma estatal define el voluntar
- Page 689 and 690:
-- Cumplir los compromisos adquirid
- Page 691 and 692:
Esta actividad no retribuida tiene
- Page 693 and 694:
6.- En el campo de la empleabilidad
- Page 695 and 696:
y León ha elaborado su propia norm
- Page 697 and 698:
que guarden relación con la cooper
- Page 699 and 700:
Castilla y León, el cálculo de la
- Page 701 and 702:
servicio previsto en el Programa in
- Page 703 and 704:
cuidado de familiares que tengan la
- Page 705 and 706:
empleo, como la agricultura ecológ
- Page 707 and 708:
potenciando las acciones encaminada
- Page 709 and 710:
por la Federación o el hecho de qu
- Page 711 and 712:
Ahora bien, cuando se impide al jug
- Page 713 and 714:
-- Tengan licencia deportiva en vig
- Page 715 and 716:
-- Crear infraestructuras y lograr
- Page 717 and 718:
A nivel estatal, y desde hace relat
- Page 719 and 720:
-- Cese Anticipado de la Actividad,
- Page 721 and 722:
forestales, la realización de mejo
- Page 723 and 724:
Añadido, cuando los mismos se conc
- Page 725 and 726:
éstas y los centros de investigaci
- Page 727 and 728:
la ley de la selva. Las condiciones
- Page 729 and 730:
domésticos (60,4%), la confección
- Page 731 and 732:
No se trata en ningún caso de una
- Page 733 and 734:
la falta de afiliación/alta y desc
- Page 735 and 736:
políticas que, de tener éxito, de
- Page 737 and 738:
laboral, la de residencia habilitar
- Page 739 and 740:
Han sido considerados, como ya se h
- Page 741 and 742:
CARRIL VÁZQUEZ, X.M.: “Sobre el
- Page 743 and 744:
LUJÁN ALCARAZ, J.: “El socio tra
- Page 745 and 746:
Abreviaturas ATA Asociación de Tra
- Page 747:
RXG Revista Xurídica Galega SIPES


